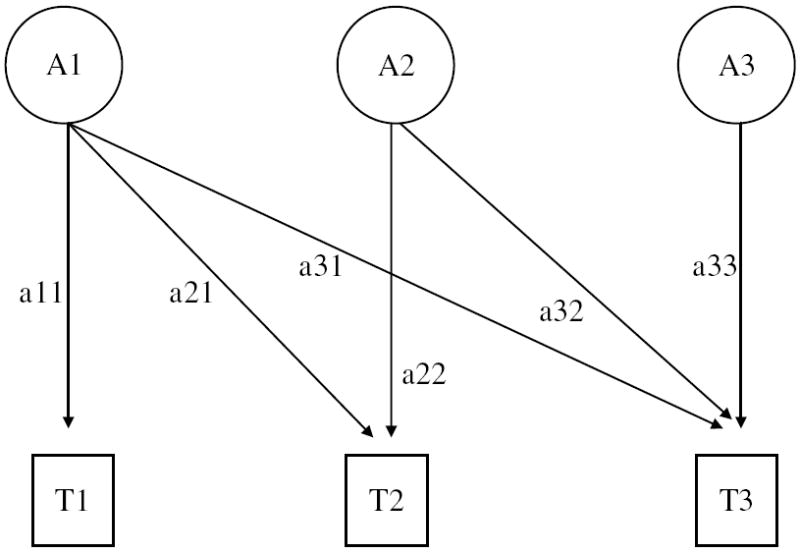
Fig. 1.

Path diagram of a three-variable case Cholesky decomposition model (additive genetic factors). Paths, which are squared to estimate the proportion of variance accounted for, are represented by lowercase letters. The first genetic factor represents the contributions of the first occasion (T1) to all subsequent occasions (T2, T3), the second gives the contributions of every new source of variation at the second occasion (T2, T3) to subsequent occasions, and the last factor is the contribution of effects specific to the last occasion (T3).
