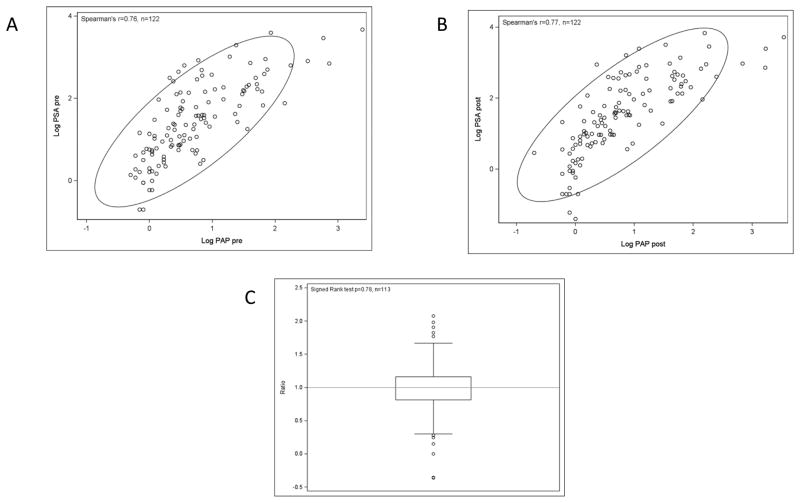
Figure 3.
Unchanged correlation of PSA to PAP in 122 patients treated with PROSTVAC. A, pre-vaccine scatter plot with 90% confidence ellipse. B, post-vaccine scatter plot with 90% confidence ellipse. C, box-and-whisker plot of the ratio (log PSA pre/log PAP pre)/(log PSA post/log PAP post), n = 113. There were 9 missing observations because of division by zero (5 cases in the pre ratio and 4 cases in the post ratio). If PSA antibodies were pulling PSA out of circulation, the amount of PSA per unit of PAP would decrease.

