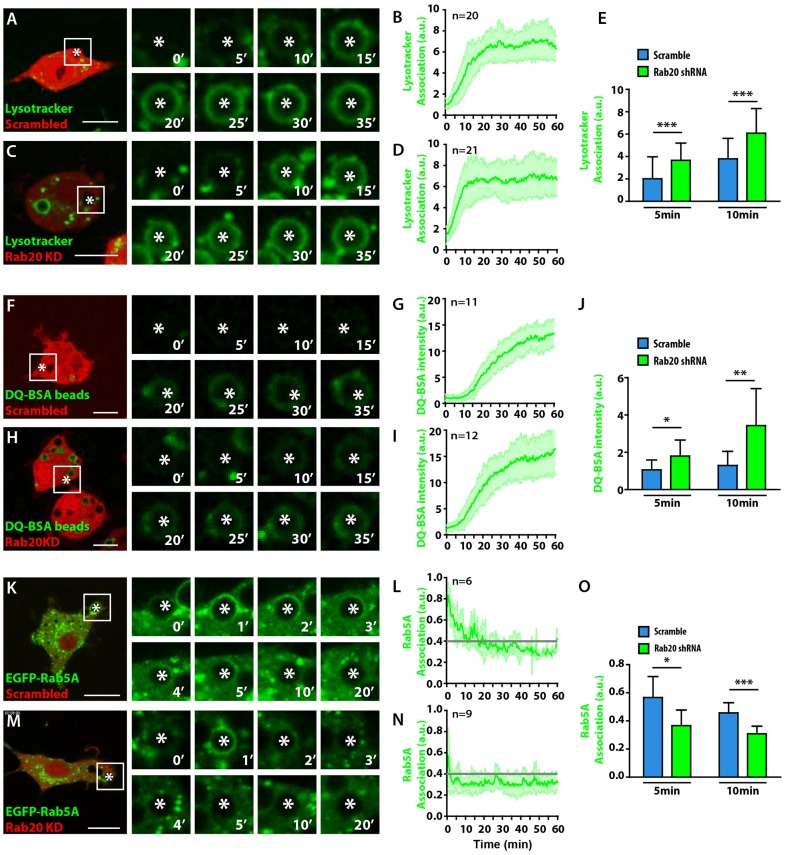
Fig. 4.
Rab20 is required for a delay in phagosome maturation and for the recruitment of Rab5a. (A) The kinetics of LTG acquisition by phagosomes in RAW264.7 macrophages expressing scrambled shRNA. Cells were incubated with LTG for 30 min and were subsequently incubated with 3-µm IgG-coated beads and analyzed by live-cell imaging. (B) Quantitative analysis of the intensity of LTG association with phagosomes post-internalization. (C) The kinetics of LTG acquisition by phagosomes in macrophages expressing Rab20 shRNA (Rab20 KD). (D) Quantitative analysis of the intensity of LTG association with phagosomes post-internalization. (E) Data points from B and D were pooled. (F) The kinetics of phagosomal degradation of DQ-BSA-coated beads in macrophages expressing scrambled shRNA. (G) Quantitative analysis of the intensity of DQ-BSA-coated beads in phagosomes. (H) The kinetics of the phagosomal degradation of DQ-BSA in macrophages expressing Rab20 shRNA. (I) Quantitative analysis of the intensity of DQ-BSA in phagosomes. (J) Data points from G and I were pooled. (K) The kinetics of the association of Rab5a with phagosomes in macrophages expressing scrambled shRNA. (L) Quantitative analysis of the intensity of the EGFP–Rab5a association with phagosomes post-internalization. (M) The kinetics of the association of Rab5a with phagosomes in macrophages expressing Rab20 shRNA. (N) Quantitative analysis of the intensity of EGFP–Rab5a association post-internalization. (O) Data points from L and N were pooled. White asterisks, the phagosome of interest. Scale bars: 10 µm. n, the number of phagosomes analyzed in at least three different cells. Grey lines in panels L and N represent the background levels. The data show the mean±s.d. from at least three independent experiments. *P≤0.05, **P≤0.01, ***P≤0.001 (Student's two-tailed unpaired t-test).

