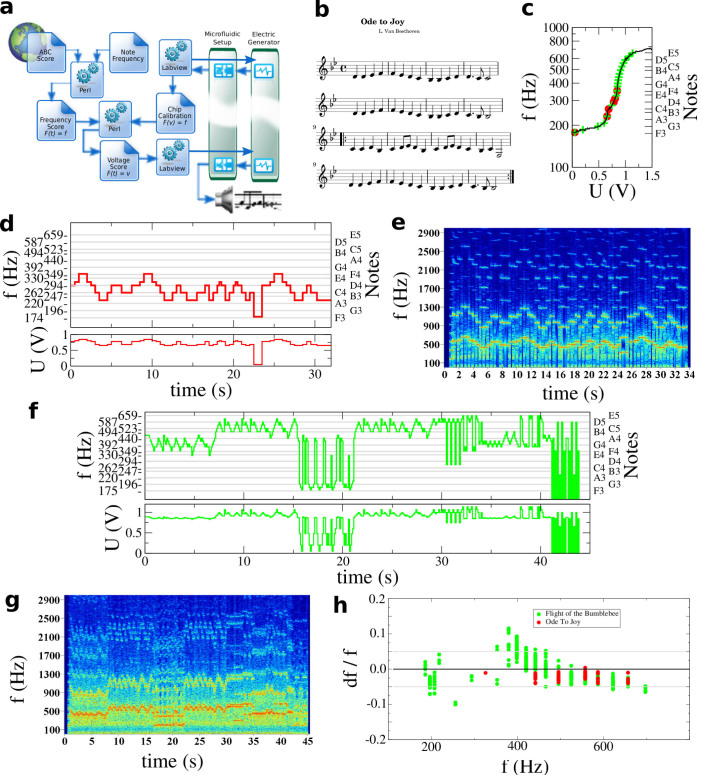
Figure 4. The microfluidic Jukebox.
(a) Scheme of the instrumentation process. A score, for example here Ode to Joy, Beethoven (b) is downloaded from the web. Based on the calibration curve of the chip (c) the score is converted and transposed using a Perl script in a series of frequencies accessible to the microfluidic chip (d). A Labview routine reads the series of frequencies to apply the corresponding voltage to the chip (see also Figure 2). (e) The signals are recorded on an audio card and further analyzed to determine the frequency spectrum of the sound as a function of time. A similar scheme is used for The Flight of the Bumblebee, Korsakov (See Supplementary Figure 2), to determine the control voltages (f) and record and analyze the sound (g). Finally, we analyze the measured frequency as a function of the target frequency and display the relative error (df/f) between both. All notes are within less that 5% error for the Ode to Joy. A larger error is made with The Flight of the Bumblebee as a result of the wider frequency range of the whole score, speed of actuation and step between notes. See also Supplementary Figure 4 for additional information and the Supporting audio and video files to listen to the sound of the microfluidic Jukebox.

