
Figure 9.
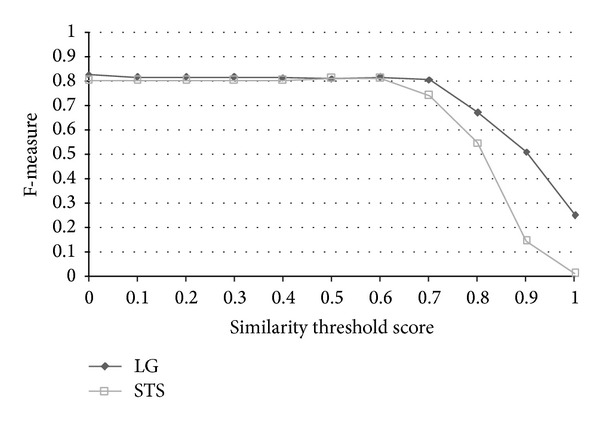
F-measure versus similarity threshold curves of STS and LG for eleven different similarity thresholds.
Official websites use .gov
A
.gov website belongs to an official
government organization in the United States.
Secure .gov websites use HTTPS
A lock (
) or https:// means you've safely
connected to the .gov website. Share sensitive
information only on official, secure websites.
F-measure versus similarity threshold curves of STS and LG for eleven different similarity thresholds.