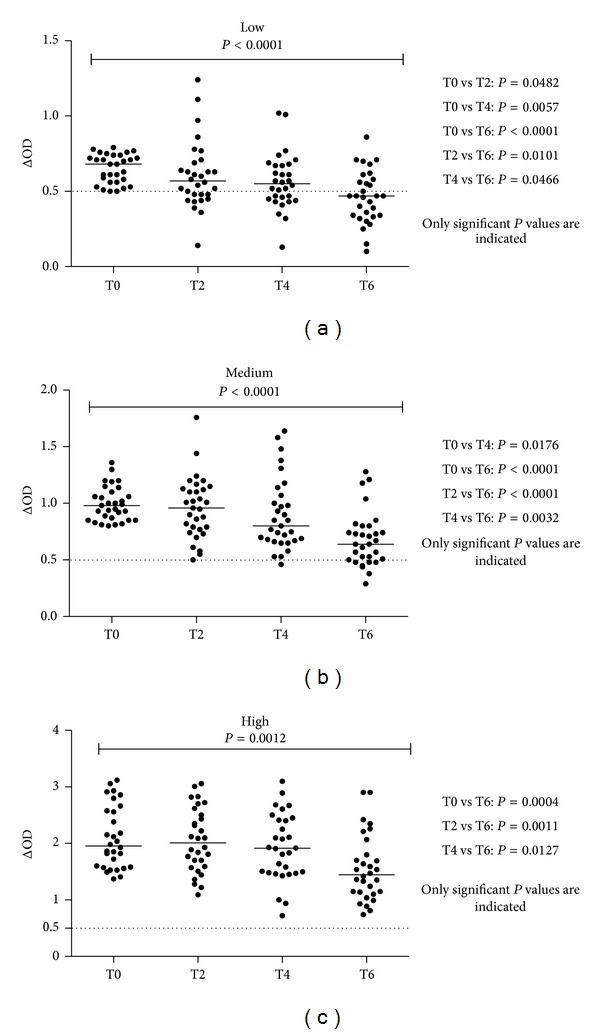
Figure 3.

Evolution of individual IgG response to Ae. albopictus SGE according to initial Ab level, Reunion Island, 2010. The results of antisaliva IgG Ab level between T0 and T6 were presented for low (a), medium (b), and high (c) groups of “immune responders.” Bars indicate median value in each group and the dotted line represents the threshold of specific Ab response to Ae. albopictus SGE (ΔOD = 0.5). For all groups, the Kruskal-Wallis indicated significant difference between the different time periods: P < 0.0001, P < 0.0001, and P = 0.0012 for low, medium, and high groups, respectively. In the “low” group (a), test showed significant difference in T0 versus T2 (P = 0.0482), T0 versus T4 (P = 0.057), T0 versus T6 (P < 0.0001), T2 versus T6 (P = 0.0101), and T4 versus T6 (P = 0.0466); in “medium” group (b): T0 versus T4 (P = 0.0004), T0 versus T6 (P < 0.0001), T2 versus T6 (P < 0.0001), and T4 versus T6 (P = 0.0032); in “high” group (c): T0 versus T6 (P = 0.0004), T2 versus T6 (P = 0.0011), and T4 versus T6 (P = 0.0127).
