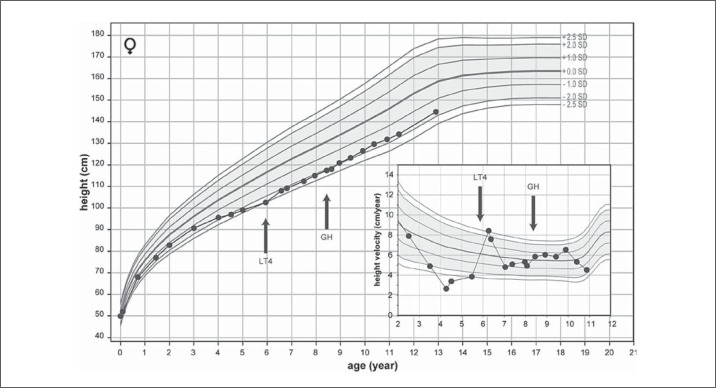
Fig. 1.
Growth chart of the 11-year-old girl (P2) with an inactivating mutation in the TRα1 portion of the THRA gene, with growth velocity in the inset. The growth curve is compared with the normal range for the Greek population. The initiation of LT4 and GH therapy is indicated by the arrows. Adapted from van Mullem et al. [25] with permission.

