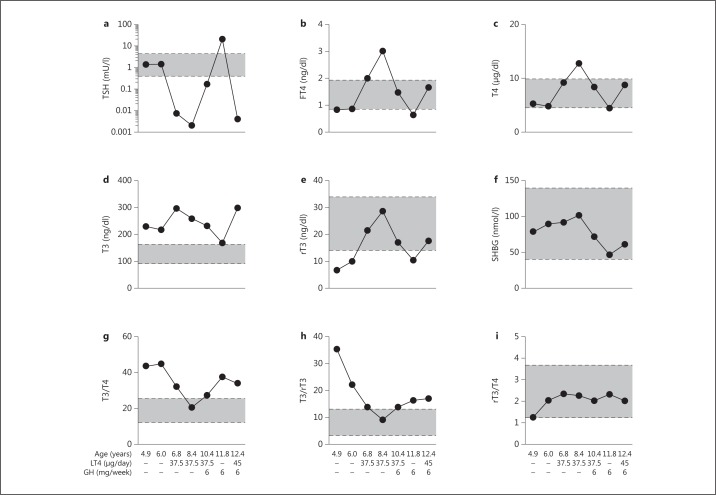
Fig. 2.
Results of serum thyroid function tests and SHBG levels in samples collected from female patient P2 with an inactivating mutation in the TRα1 portion of the THRA gene under different treatment modalities (on and off LT4 and/or GH therapy) at different time points. The horizontal lines represent the different reference ranges. Adapted from van Mullem et al. [26] with permission.

