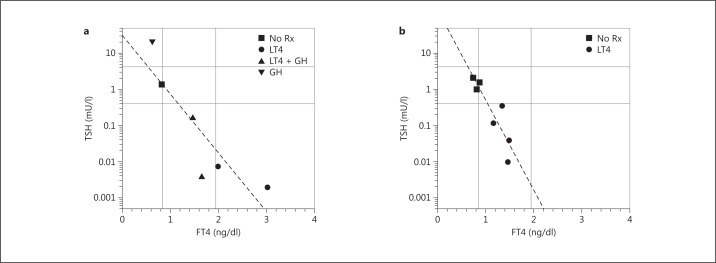
Fig. 3.
Serum TSH plotted as a function of serum FT4 levels in a female patient (P2; a) and her father (P3; b) with an inactivating mutation in the TRα1 portion of the THRA gene. Different symbols represent different treatment modalities (on and off LT4 and/or GH therapy). The regression line is based on all data points. Reference ranges are indicated by the horizontal and vertical lines. Rx = Medication. Adapted from van Mullem et al. [26] with permission.

