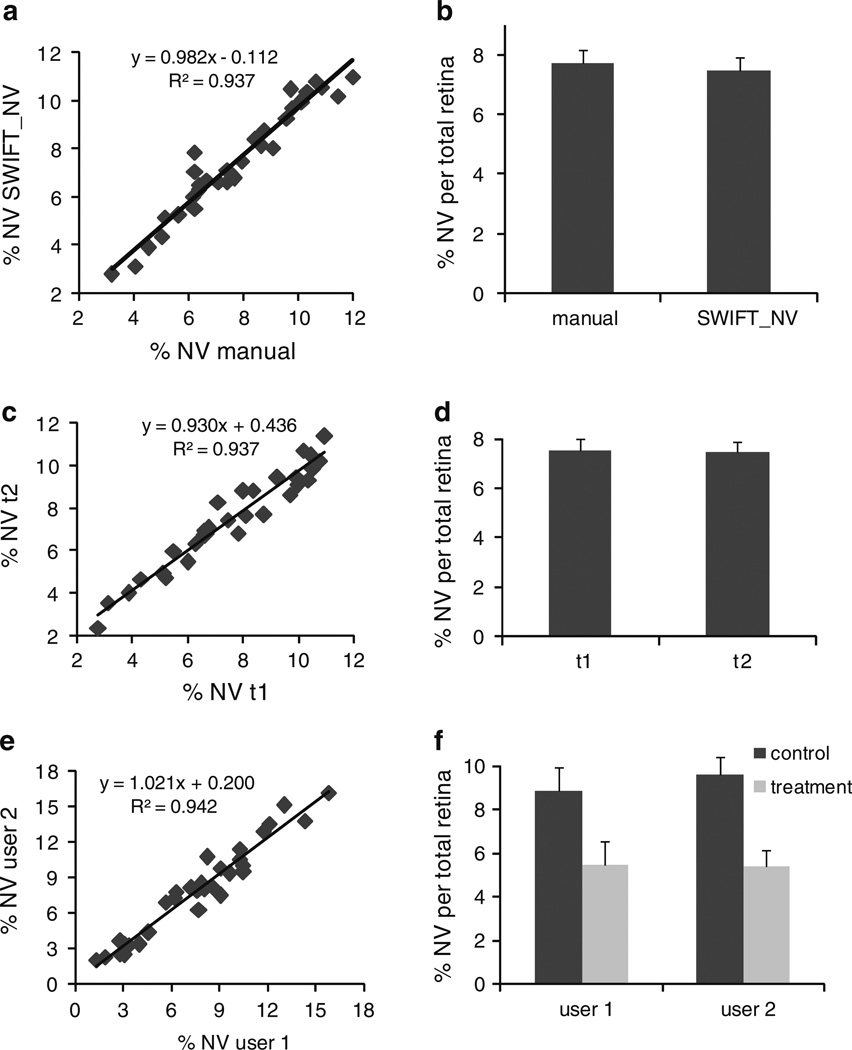
Fig. 3.
Comparison between manual NV quantification and the SWIFT_NV method shows close correlation between the two methods over a wide range of NV (a). Mean values and standard error do not differ between manual measurement and SWIFT_NV quantification (b). Repeated measurements of the same data set by the same user after a 3-month time interval show high intra-individual reproducibility (c, d). The second quantification (t2) correlates well with the original measurements (t1; c). Mean value and standard error are almost exactly reproduced (d). Comparison of two users independently quantifying the same images shows high inter-individual correlation (e). Both users obtained almost identical values for the control and treatment group contained in the data set (f). All measurements were done on n = 30 retinas

