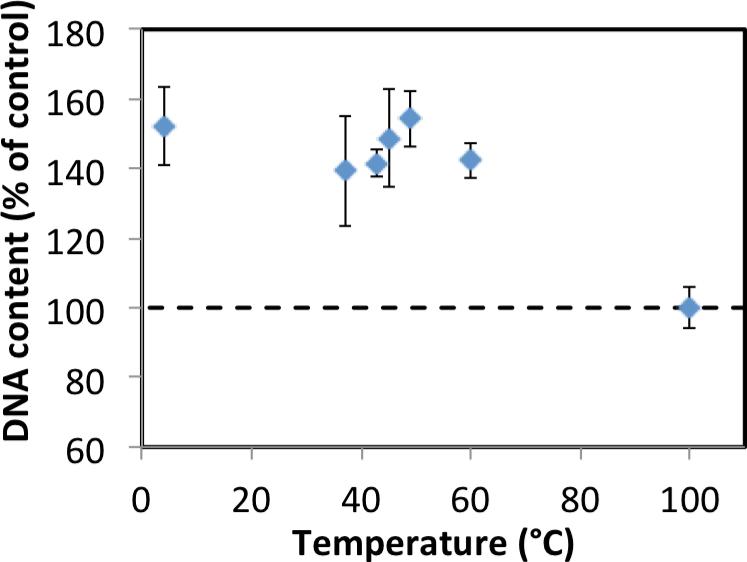
Figure 3.
Effect of heat-treated IGF-I solution on cell proliferation as measured by DNA content. The dashed line represents the DNA content in cells cultured without growth factor. IGF-I solution that had been incubated at increasing temperatures for 2 days. Data are mean ± standard deviation (n=3).

