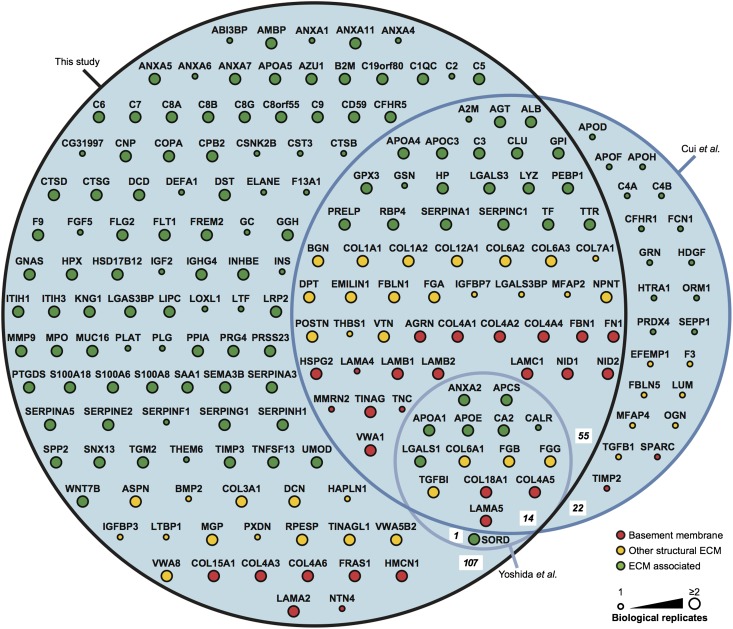
Figure 3.
Comparison of the glomerular ECM proteome with published glomerular proteomic datasets. The glomerular ECM proteome identified in this study was compared with other glomerular proteomic studies for which full datasets were available (studies by Cui et al.25 and Yoshida et al.22). Numbers of proteins in each intersection set of the area proportional Euler diagram are in bold italics. ECM proteins were categorized as basement membrane, other structural ECM, or ECM-associated proteins, and they were colored and arranged accordingly. Nodes (circles) are labeled with gene names for clarity. ECM proteins detected in any of the three biologic replicates reported in this study were included in the comparison with other proteomic datasets; these published datasets each reported one biologic replicate. Large node size indicates proteins detected in at least two biologic replicates in this study.

