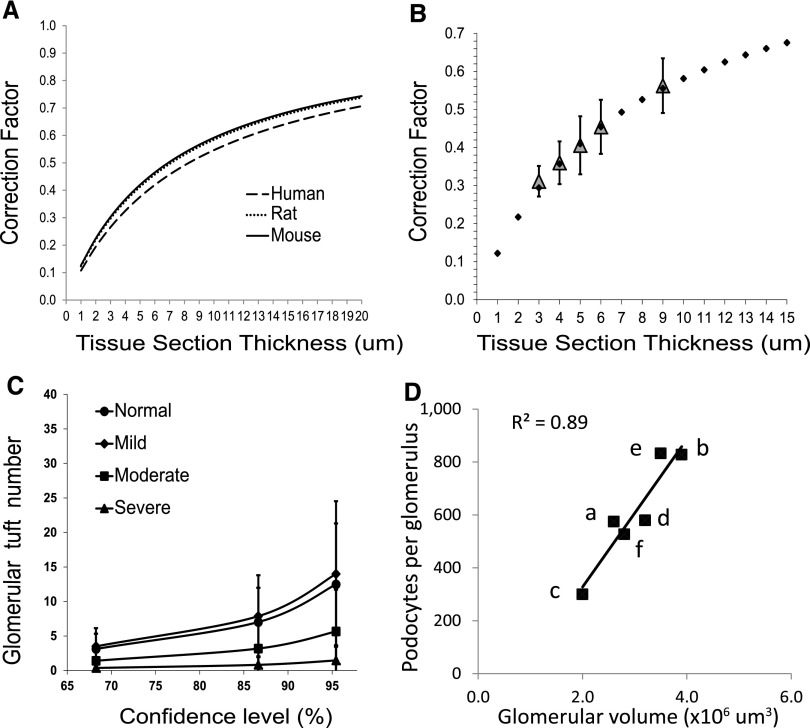
Figure 3.
(A) CF variation in relation to section thickness for each species. The curves for human podocyte nuclei (mean caliper diameter 8.3 μm), rat podocyte nuclei (mean caliper diameter 7.1 μm), and mouse podocyte nuclei (mean caliper diameter 6.9 μm) are shown in relation to section thickness (x-axis) and the CF (y-axis) as calculated using the equation CF=1/(D/T+1). Note that the curves for rat and mouse are almost superimposable and that even the difference in nuclear size between human and rodent podocytes changes the CF by a relatively small amount (<10%). (B) Observed CF reflects predicted CF. CF values for sections of different thicknesses are estimated by comparing the observed number of podocyte nuclei in a section with the known number of podocyte nuclei per glomerulus measured using the two-thickness method and confirmed by serial sectioning through whole glomeruli to count all podocytes in five tissue blocks from different rat kidneys. The values for the CF at each section thickness±1 SD are plotted in relation to the section thickness (gray diamonds). A CF curve calculated using the equation CF=1/(D/T+1) using mean podocyte nuclear caliper diameter measured for rat podocyte nuclei of 7.1 μm is shown for a range of tissue section thickness (closed diamonds) demonstrating that the measured CF values corresponded to the CF values derived from the equation over a wide range of section thicknesses. (C) Glomerular tuft number required to reliably estimate podocyte density. The graph shows the confidence limits (x-axis) and tuft sample size required (y-axis) to obtain a value for podocyte number within 5% of the true value (derived from a sample size of 50 glomerular tufts). Data are from rats that have >90% of normal (n=15), mild (60%–89% of normal; n=10), moderate (30%–59% of normal; n=8), and severe (<30% of normal; n=9) podocyte depletion. Less than eight tuft profiles are required to arrive at a value within 5% of the measured value with 90% confidence for any level of podocyte depletion. (D) Published data for podocyte number per tuft and glomerular volume for donor kidneys varies 2- to 3-fold, as shown in Table 3. For kidney transplant donors, there are large differences in the estimated glomerular volume and podocyte number per tuft between different reports. However, when plotted against each other, there is a strong correlation between glomerular volume and podocyte number per glomerulus, indicating that the relationship between these two variables (podocyte density) does not vary much between different methods. The letters in D correspond to the following references: a, Pagtalunan et al. (1997)1; b, Steffes et al. (2001)11; c, Lemley et al. (2002)13; d, White et al. (2002)12; e, Dalla Vestra et al. (2003)14; and f, Venkatareddy et al. (current report).

