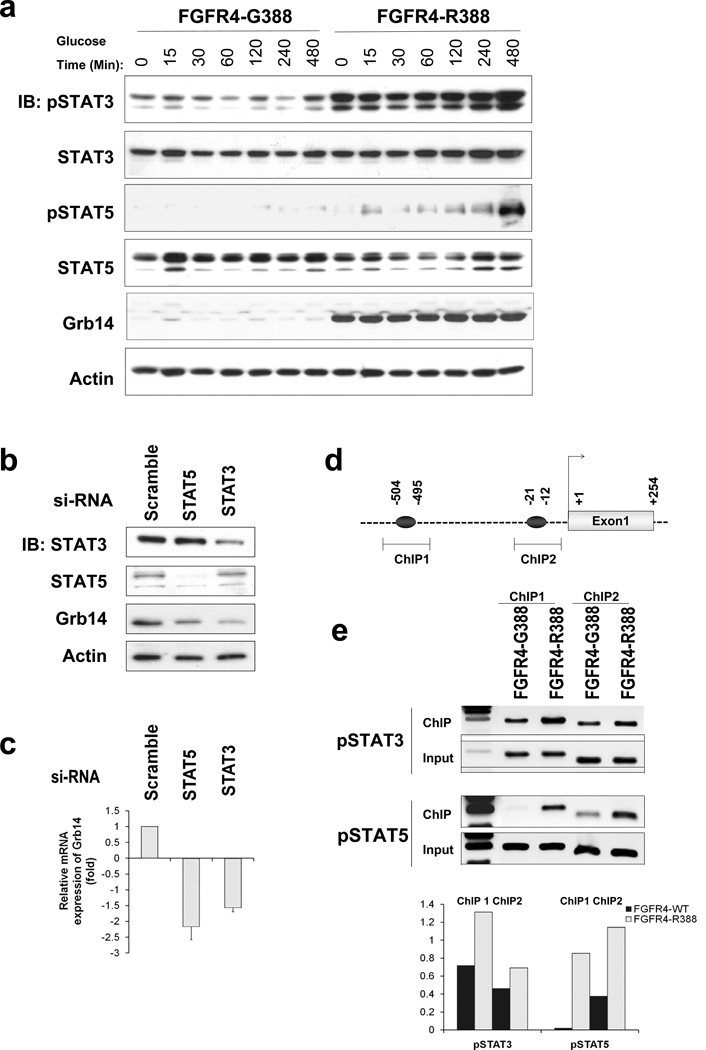
Figure 3. FGFR4-R388 Preferentially Signals through STAT3/5 to Induce Grb14.
(A) Pancreatic islet RINm5F cells expressing FGFR4-G388 or FGFR4-R388 were compared for their ability to signal through STAT3 or STAT5 during a time-course reflecting the duration of exposure to 8 mmol/liter glucose. Note pY-STAT3 and pY-STAT5 responses by FGFR4-R388 cells, which are appreciably greater and more sustained than in FGFR4-G388 cells. (B) FGFR4-R388 cells were transfected with siRNA oligonucleotides to knock down STAT3 or STAT5 as indicated. Western blotting demonstrates STAT3 or STAT5 reduction and associated diminished Grb14 expression. For each knockdown, three independent siRNA oligonucleotides were used yielding similar results (data not shown). (C) Quantitative real-time PCR of STAT3/5 downregulated cells from panel b show corresponding reduction in Grb14 mRNA expression. (D) The 50 Grb14 region contains two putative STAT binding sites as indicated. The highlighted regions were targeted for chromatin immunoprecipitation (ChIP) examination. (E) ChIP assays show enhanced pY-STAT3 and pY-STAT5 binding to the Grb14 promoter in cells expressing FGFR4-R388 compared to FGFR4-G388. Densitometric values from three independent experiments are shown immediately below. See also Figure S2 and Table S4.

