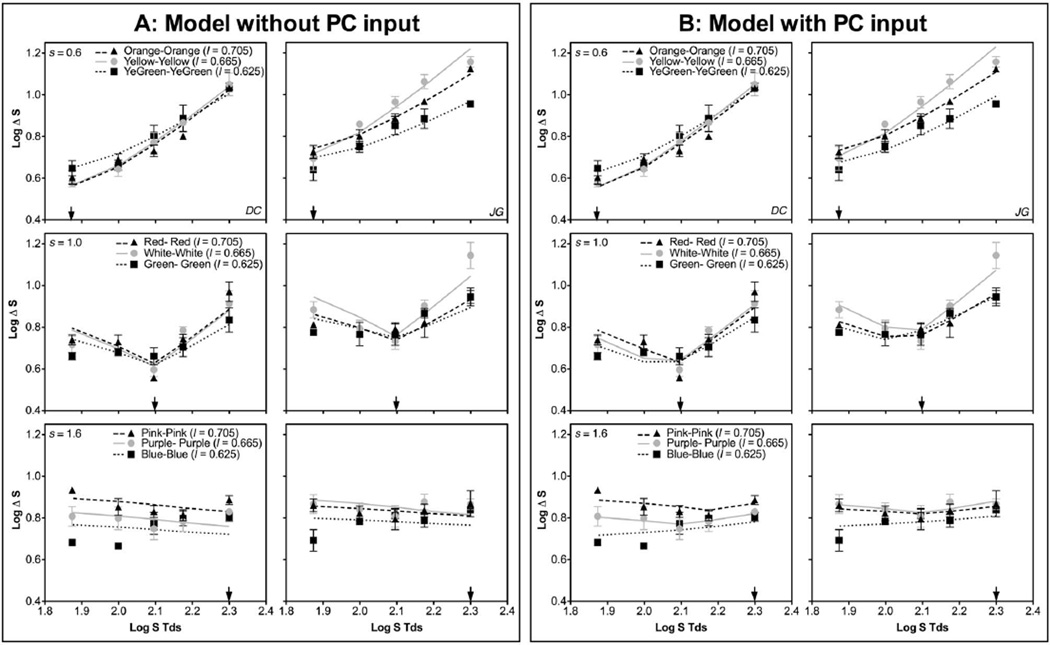
Fig. 3.
S-cone discrimination thresholds from Experiment 1, expressed as log ΔS trolands, as a function of annulus log S trolands, for observers DC and JG. Top row, adapting s = 0.6; middle row, adapting s = 1.0; bottom row, adapting s = 1.6. Each panel shows the thresholds at three different adapting l chromaticities of 0.625, 0.665, and 0.705, with the adapting s chromaticity indicated by an arrow. A, model fits assuming no PC-pathway input to the KC pathway (Model 1). B, model fits assuming PC-pathway input to the KC pathway (Model 2).

