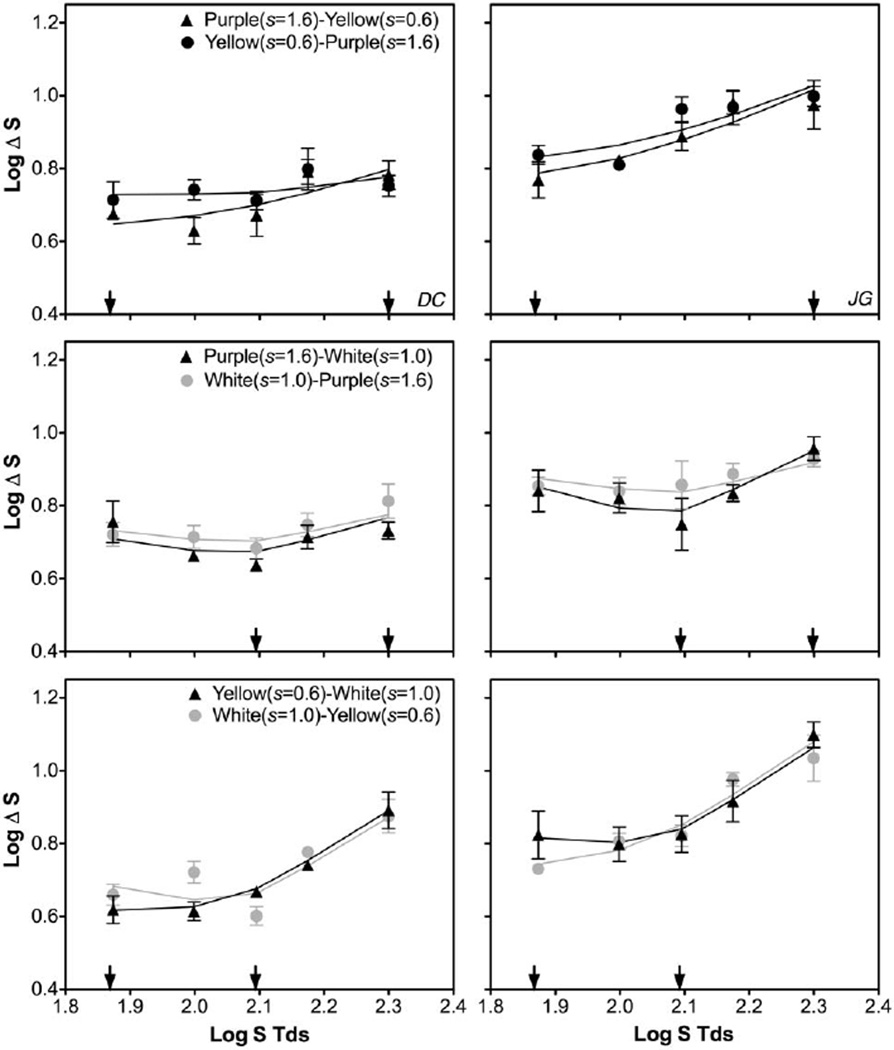
Fig. 6.
S-cone discrimination thresholds from Experiment 3, with two adapting fields having different s but the same l chromaticities (l = 0.665). The arrows in each panel indicate the two adapting s chromaticities. The solid lines are model fits based on integration of spectral signals from both adapting fields.

