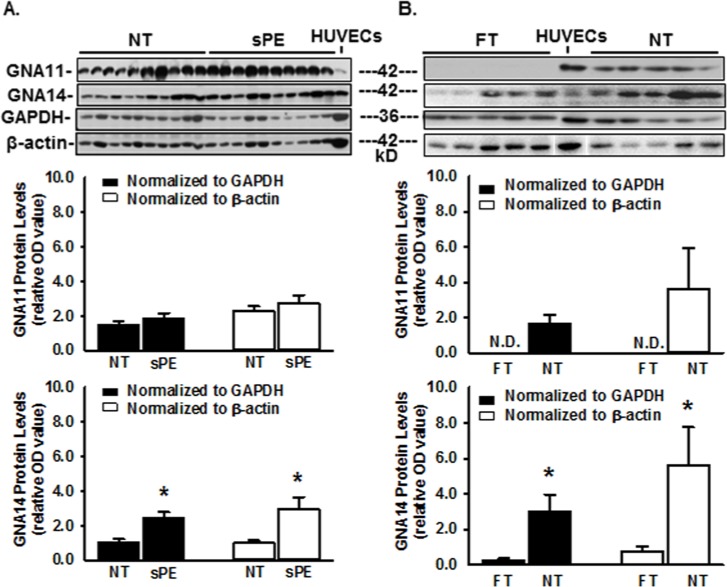
Figure 3.
Western blot analysis for GNA11 and GNA14 in human placentas and in HUVECs. (A) Placentas from normal term (NT) and severe preeclamptic (sPE) pregnancies (n=10/group) and HUVECs from NT pregnancies. (B) Placentas from FT and NT pregnancies (n=10/group). A representative image is shown for Panel B. Proteins (100 μg in A and 50 μg in B for each placental sample, as well as 20 μg for HUVECs) were subjected to Western blotting. Data are expressed as mean ± SEM of OD values normalized to GAPDH or β-actin. N.D.: non-detectable. *p<0.01.

