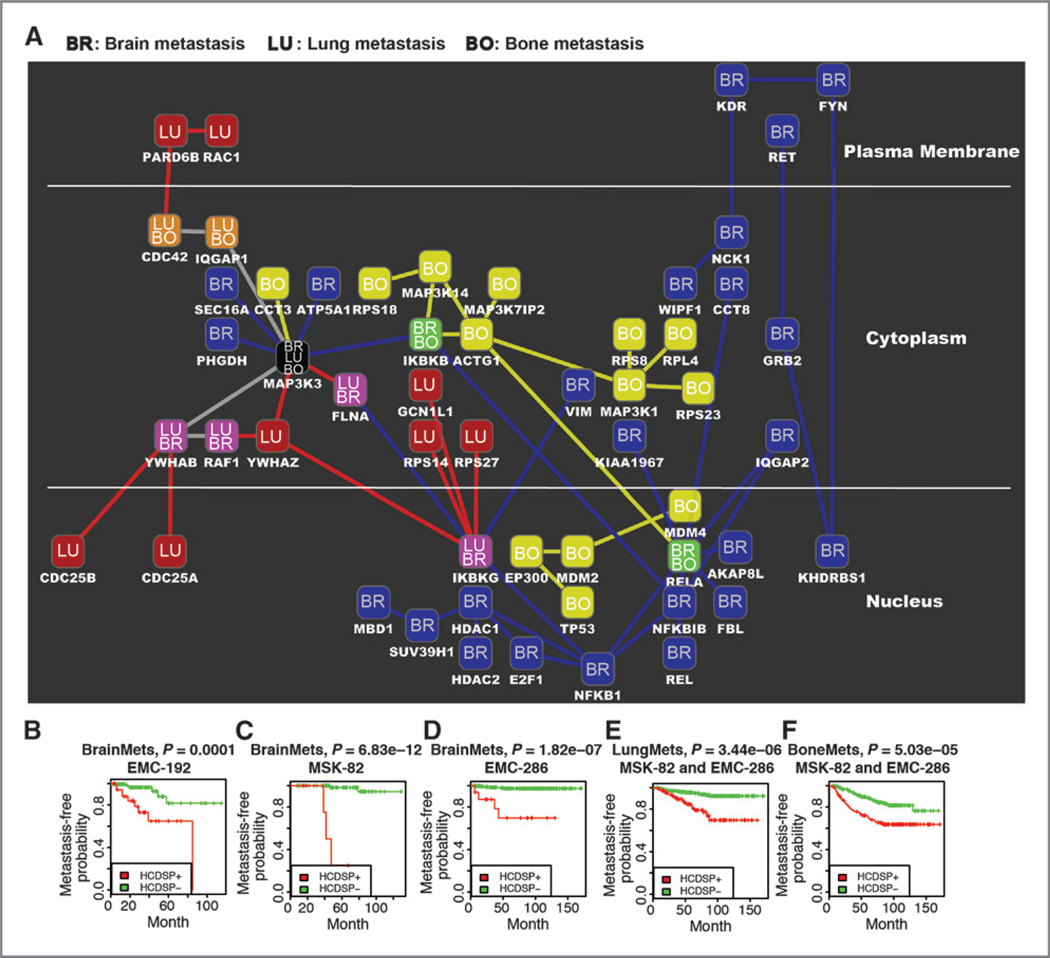
Figure 2.
Signaling networks for brain, lung, and bone metastases of breast cancer. A, the signaling networks for the three metastatic sites are denoted by the labels in the nodes as well as the colors in the nodes and the interactions. Brain, blue BR; lung, red LU; and bone, yellow BO. The shared nodes are represented by the labels BR/LU, BR/BO, LU/BO, and BR/LU/BO. The artwork was generated by using Cytoscape (47). B, the Kaplan–Meier curves for metastasis-free survival on the basis of brain, bone, or lung HCDSP path-level values in the indicated cohorts of breast tumors. High-confidence downstream signaling pathway (HCDSP) contains the protein paths remaining in the cut-tree algorithm with the best statistical significance in the Kaplan–Meier survival analysis. The strategy employed in the survival analysis iteratively conducted both hierarchical clustering on the decomposed protein paths of the downstream signaling pathways and Kaplan–Meier survival analysis on the metastasis-free survival times of patients. The cut-tree algorithm helps to classify the patients into HCDSP+ and HCDSP− by cutting the tree in the hierarchical clustering into branches. The HCDSP+ means the patient samples are in the branch with indicator 1, whereas HCDSP− indicates the patient samples are in the remaining branches with indicator −1, where 1 and −1 are defined by the classification based on branches in the cut-tree algorithm. For more details, please see the cut-tree algorithm in Supplementary Methods.

