Figure 3.
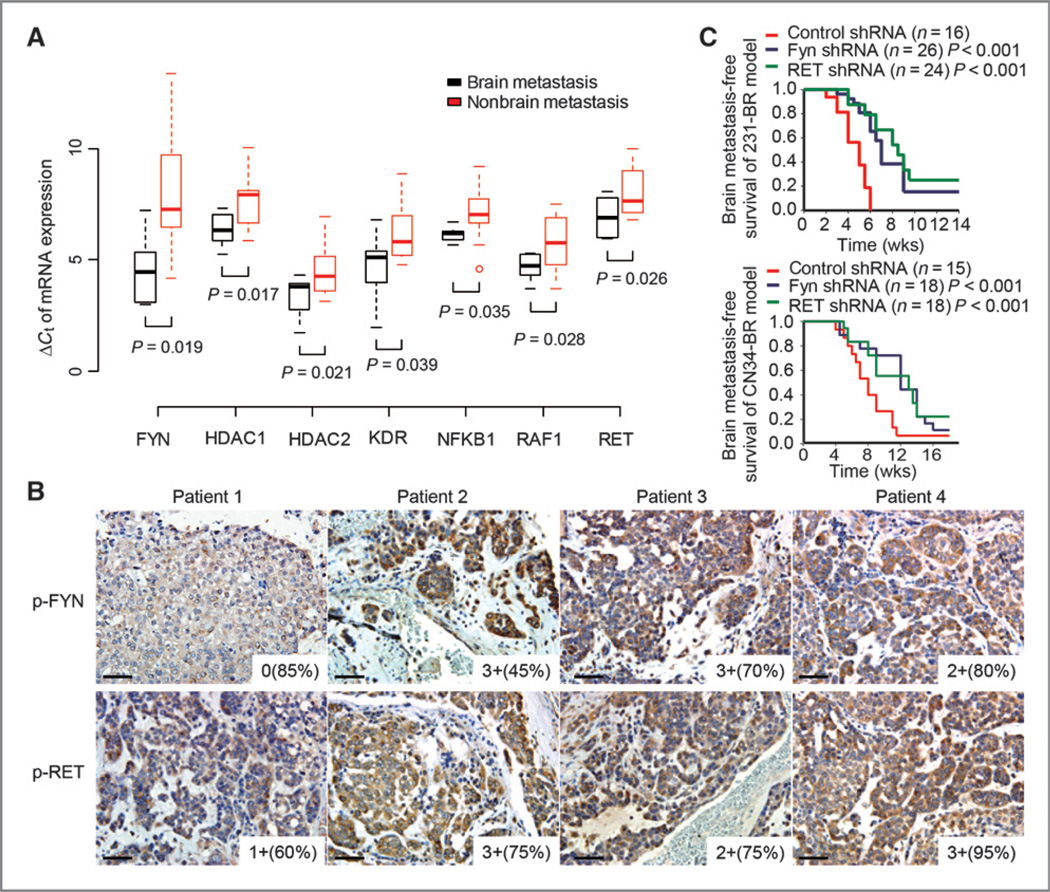
Validation of the identified brain metastasis targets. A, measurements of seven drug-target genes, FYN, HDAC1, HDAC2, KDR, NFKB1, RAF1, and RET, in primary tumors of brain relapsed patients by the 31-gene low-density real-time quantitative RT-PCR array. Primary breast tumor tissues from 20 patients with breast cancer were used for this quantitative RT-PCR array study; 11 of these patients had brain relapse. To compare expression profiles between specimens, a geometric averaging of three reference genes (ACTB, GAPDH, and RPLP0) was used for normalization as previously described (48). The average expression of the mean of the three reference genes is CT = 22.98. The Spearman rank correlation between the normalized Affymetrix data and quantitative RT-PCR array data were significantly positive for 24 of 31 (77.42%) of the genes. B, representative immunohistochemical stains of phosphorylated-FYN (p-FYN) and phosphorylated-RET (p-RET) on brain metastases tissue sections of patients of breast cancer. Images were taken under ×20 objective. Scale bar, 50 µm. Staining intensity and cellularity are indicated at the right bottom corner of each image. C, Kaplan–Meier curves for brain metastasis-free survival of mice injected with the indicated cell lines expressing shRNA vector control or shRNA targeting FYN or RET. P values were determined by log rank test.

