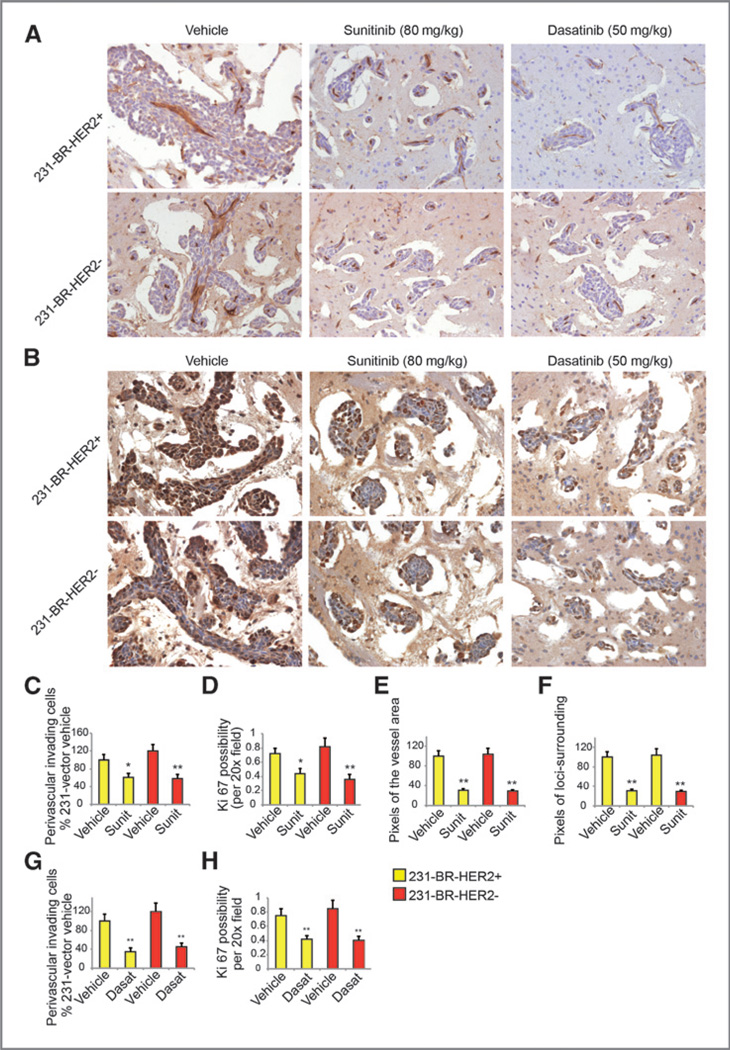
Figure 5.
Mechanism of sunitinib and dasatinib on brain metastases. A and B, representative IHC of CD31 (A) and Ki67 (B) staining on the brain sections. Images were taken under ×20 objective. The brown signals are from the sections with positive staining. C, D, G, and H, quantification of the perivascular invading cells and possibility of Ki67 expression. E and F, quantification of the pixels of the vessel area and pixels of the loci-surrounding edema area. *, P < 0.05 versus vehicle; **, P < 0.01 versus vehicle.

