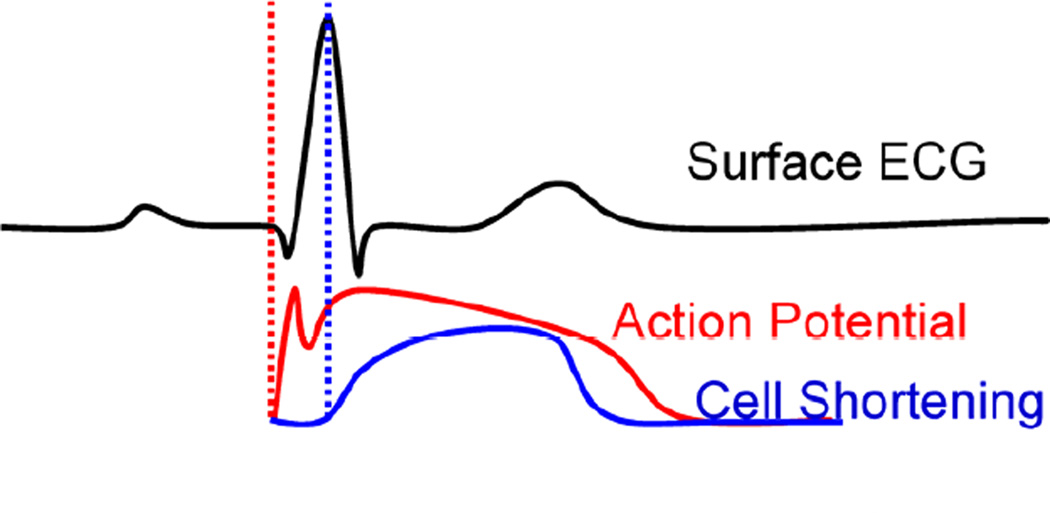
Figure 1.
Electromechanical Coupling (adapted from Cordeiro et al. 2004). The first vertical dotted line indicates the onset of electrical activation and the second one the onset of mechanical contraction. The phenomenon of excitation-contraction coupling is shown here on the level of the myocyte and how it is reflected on the ECG, where the electromechanical activation will be delayed by the ‘electromechanical delay’ relative to the onset of the QRS complex.

