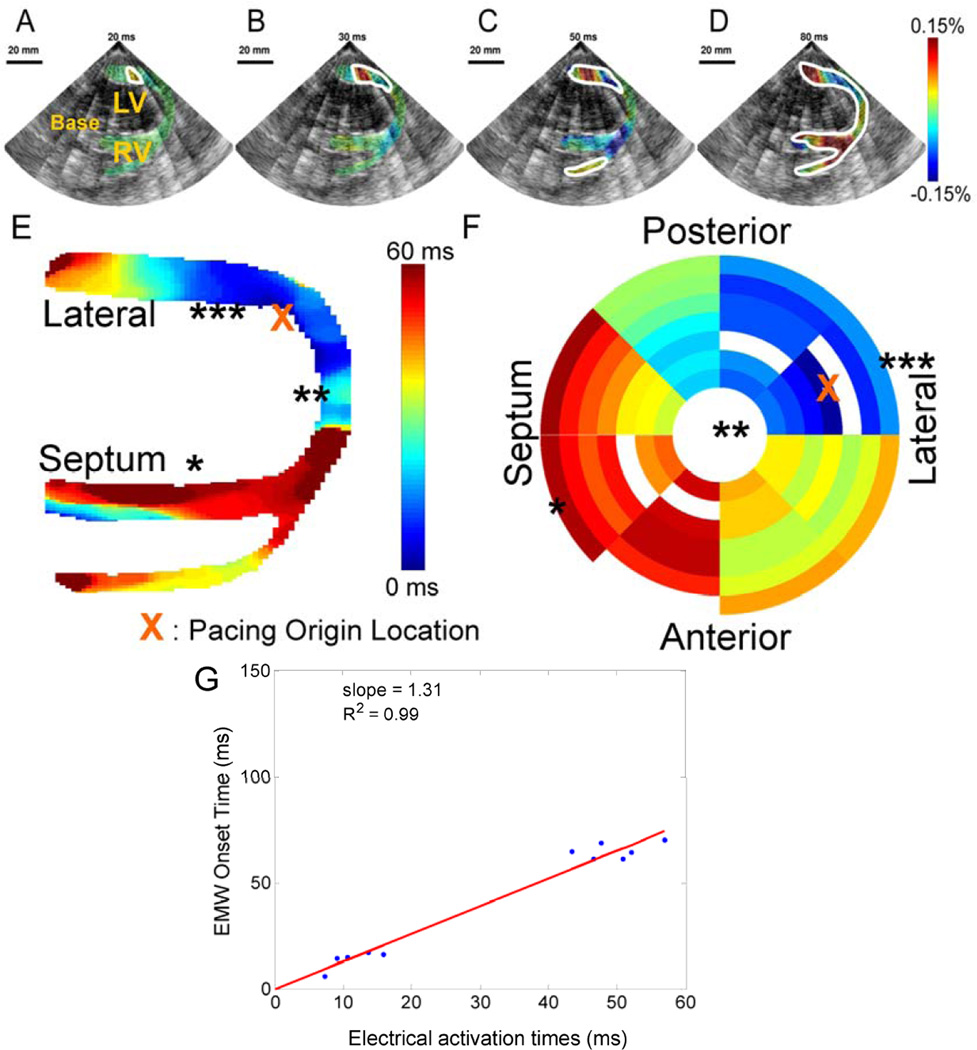
Figure 7.
The EW in a canine during pacing from the apical region of the lateral wall. A. Activation (red) originates from the endocardium and B. propagates both towards the apex (in blue, due to the orientation of the probe) and the base. C. The RV wall is then activated, D. followed by the septum. E. Corresponding EWI isochrones. F. Electrical isochrones, depicting the activation on the 3-D endocardial surface of the heart. The symbols *, ** and *** indicate corresponding regions between E and F. G. Using the electrical activation times measured using the basket catheter, the electrical activation times can be compared to the EW onset time. Since no ECG was acquired during this acquisition, the intercept was fixed to 0 ms.

