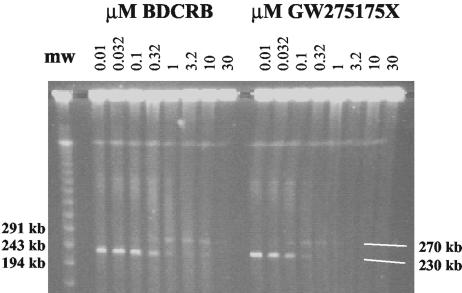
FIG. 2.
Analysis of HCMV DNA maturation using CHEF electrophoresis. Lambda concatemeric molecular weight markers are shown in the far left lane. The remaining lanes show HCMV DNA from infected cells incubated in the presence of increasing concentrations of BDCRB or GW275175X. The white lines in the lower right corner indicate the location of monomeric viral DNA of ∼230 kb near the bottom of the gel and of a ∼270-kb viral form that appears during treatment with partially inhibitory concentrations of BDCRB.

