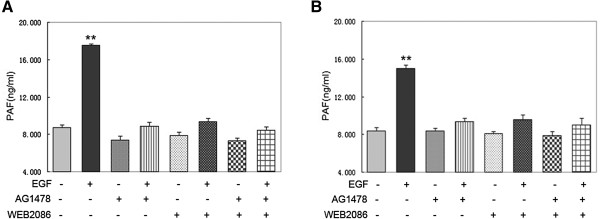
Figure 3.

Effects of an EGFR inhibitor and PAFR inhibitor on EGF-induced PAF production. CAOV3 (A) and SKOV3 (B) cells were serum starved and then pretreated with 10 μM AG1478 or 50 μM WEB2086 or a combination of AG1478 and WEB2086 for 30 min. Cells were then stimulated with 10 ng/ml EGF for 30 min. Medium was harvested, and the amount of PAF was measured. In A and B, bars represent the average of triplicates ± S.D.; “*” (p < 0.05) and “**” (p < 0.01) indicate a statistically significant difference compared to the untreated control.
