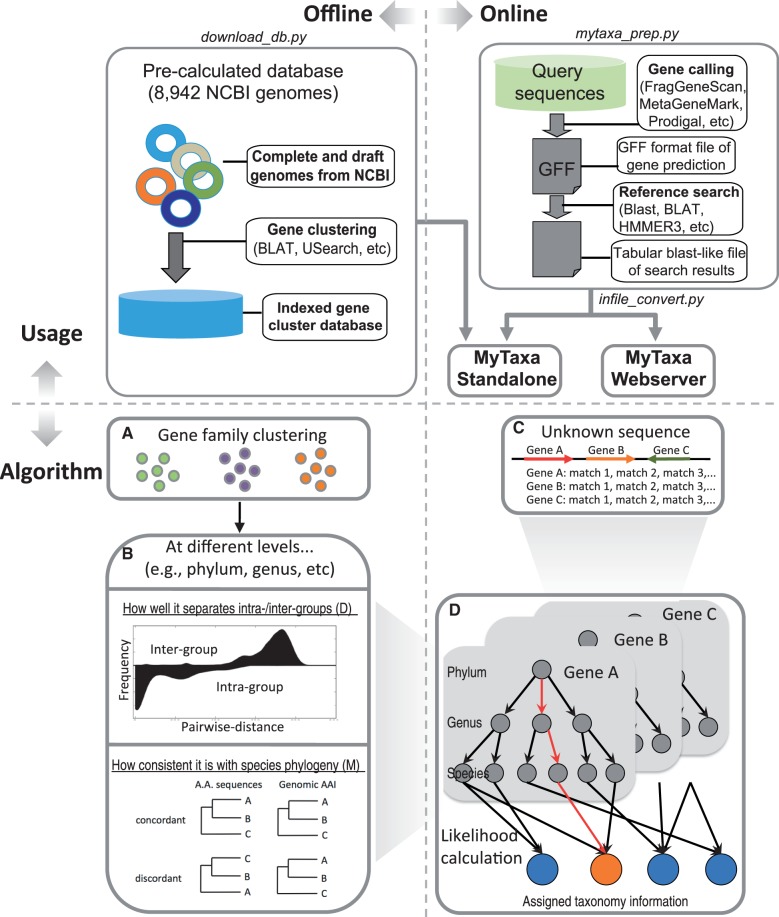
Figure 1.
The workflow of the MyTaxa algorithm. (Top) Using MyTaxa involves two parts: (i) the construction of a database that contains the weights for each gene cluster (offline part). The database is provided as part of the standalone implementation package of the algorithm. (ii) The user supplies the query sequences and the results from a similarity search of the sequences against a database such as GenBank (online part). The user can use either the webserver or the standalone implementation of MyTaxa (right). (Bottom) In the offline part, all genes from available complete or draft genomes were grouped into clusters (box A), and the weights D (how well the gene resolves the taxonomic rank) and M (how consistent the gene phylogeny is to the species phylogeny) were calculated for each cluster and taxonomic rank considered (i.e. phylum, genus and species). To quantify D, the distances among all gene sequences of a gene cluster were calculated in a pair-wise mode and categorized into ‘intra-group’ (the two corresponding genomes that encode the genes were assigned to the same taxon) and ‘inter-group’ (the two genomes were assigned to different taxa). The larger the difference between the inter-group versus the intra-group identities, the larger the classifying power of the gene with respect to D (an example of the distribution of identities is represented by the histogram shown in box B). To quantify M, all possible triplets from the phylogenetic tree of all sequences of a gene cluster were extracted and compared with the species tree, the latter approximated by the AAI tree (distance tree). Therefore, the triplets were either ‘concordant’ or ‘discordant’ with species tree (lower panel in box B). During the sequence assignment (‘online’ part; Box C). MyTaxa takes the user input and maps the matches onto the reference gene clusters generated from the offline part, based on the accession numbers of the (matching) genes from GenBank. The corresponding D and M weights are extracted for each rank that the taxon encoding the matching gene sequence is assigned to. If different genes of a query sequence or matches of a single gene suggest different classifications (i.e. matching taxon differs), each classification receives a likelihood score by merging the identity of the match and the corresponding D and M weights. If the total likelihood score of a classification (from the sum of the likelihoods of each match that supports the exact same classification) is below a minimum threshold, the classification is discarded. MyTaxa reports the classification that receives the largest likelihood score above the threshold at each taxonomy rank, together with its likelihood score (marked in red in box D).

