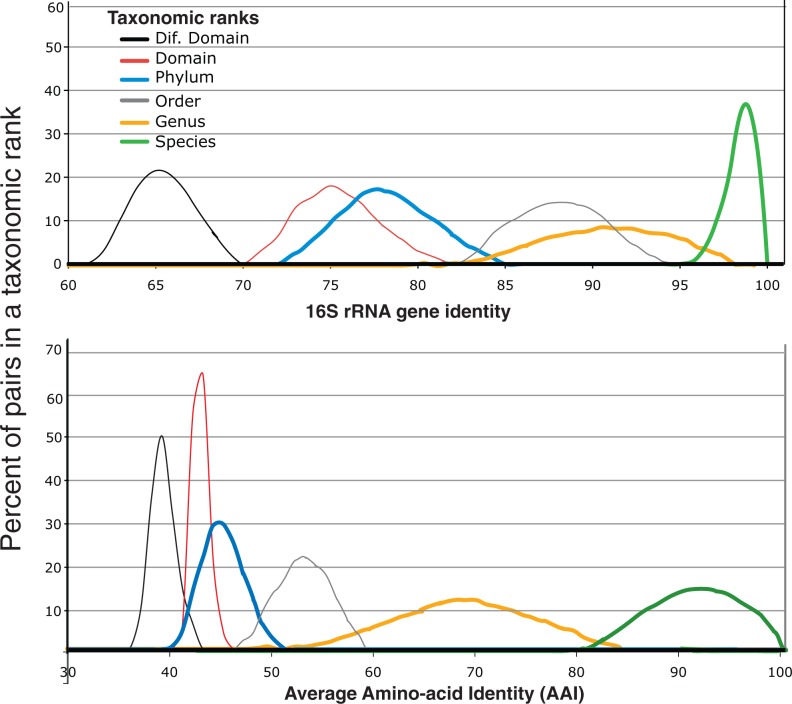
Figure 2.
Relationships between taxonomic designations and genome-aggregate average AAI. The taxonomic designations of 410 fully sequenced genomes were compared to identify the lowest taxonomic rank shared by each pair of genomes [410 × (410 – 1) = 167 690 pairs, in total], essentially as described previously (27). For each taxonomic rank (figure key), the corresponding line shown represents the distribution of the 16S rRNA gene identity (top) and AAI (bottom) values among all genomes grouped at the rank.

