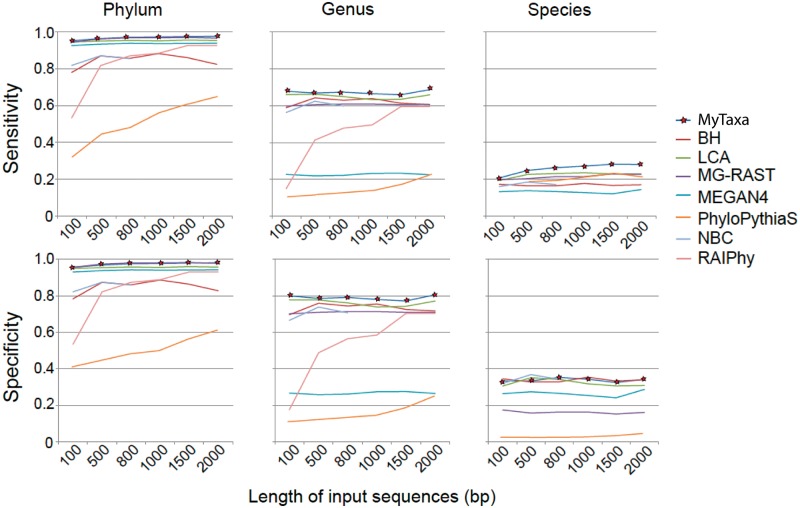
Figure 4.
Sensitivity and specificity of MyTaxa and comparison with other methods. Each line represents the sensitivity (y-axes; upper panels) or specificity (y-axes; lower panels) of a tool (figure key) on different lengths of input sequences (x-axes). Sensitivity and specificity were defined as described in the text.

