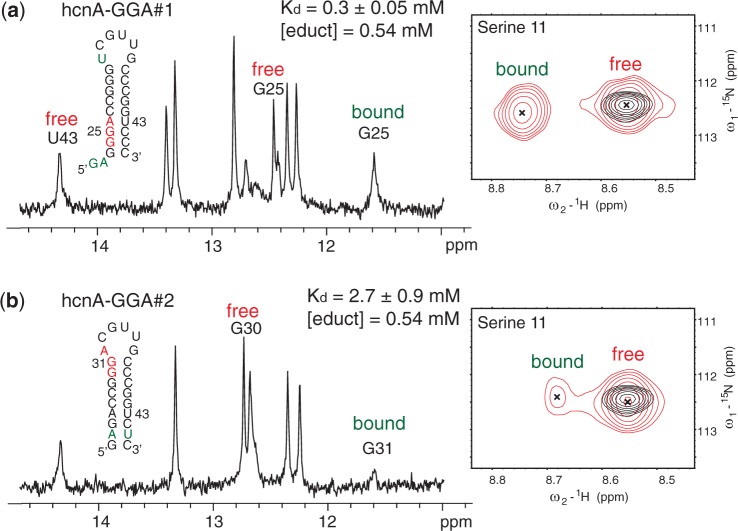
Figure 6.
Low affinity GGA motifs are in slow exchange on the NMR chemical shift time scale. (a and b) Determination of the binding affinity of the two GGA motifs located in SL1 of the 5′-UTR of the hcnA mRNA (Kd‘s in the mM range) could be performed by NMR because the resonances are in the slow exchange regime permitting to observe the free RNA, the free protein and the complex at the same time (for details see experimental part). Shown is the imino RNA region of the one-dimensional proton NMR spectrum (left) and the serine 11 amide region of the 1H-15N HSQC spectrum (right) of the hcnA-GGA#1 (a) or the hcnA-GGA#2 RNA (b) in complex with RsmE. In the 1H-15N HSQC spectrum, the free RsmE protein (black) is superimposed onto the protein–RNA complex (red). The full spectra are shown in Supplementary Figure S1. The initial educt concentrations were 0.54 mM for the RNA and the protein (monomer concentration). All the spectra were measured at 313 K. The GGA binding motifs are coloured in red, mutations or non-native nucleotides are coloured in green. For the hcnA-GGA#1, a GA dinucleotide was placed at the 5′-end to prevent quadruplex formation observed when omitting the GA. To conserve the secondary structure in the hcnA-GGA#2 RNA, the mutation of the GGA to AGA was compensated with a mutation of C45 to U45 in the opposite strand of the stem.

