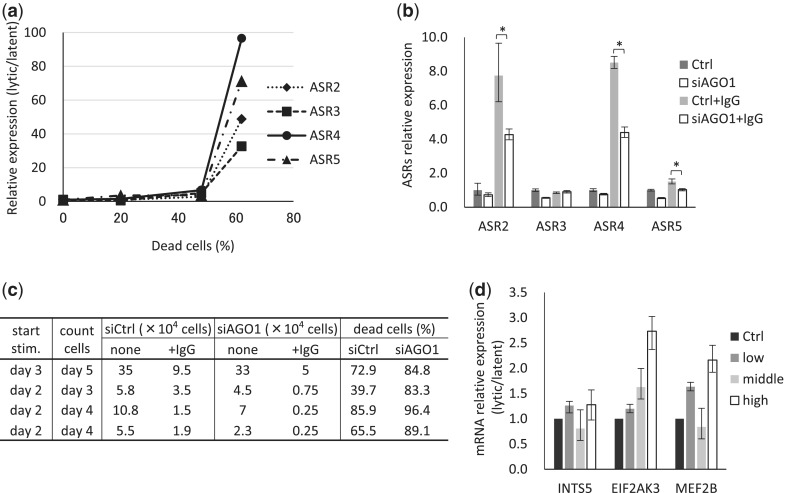
Figure 6.
Expression of ASRs is correlated with the EBV life cycle. Akata cells were stimulated with anti-human IgG antibody and induced into the lytic phase. The cells were harvested at each point and total RNAs were purified. (a and b) The expression levels of total ASRs were measured by qPCR and calibrated with GAPDH. (a) ASRs relative expression levels are shown as fold-expression changes compared with that of the latent phase. (b) Akata cells were transfected with/without siRNA against AGO1 by Neon system (siAGO1 and Ctrl, respectively). After 2 days, cells were stimulated with/without anti-human IgG antibody to induce EBV lytic phase. After 2 more days in culture, cells were harvested and relative ASRs expression to Ctrl was measured by qPCR. Ctrl and siAgo1 indicate latent phase; Ctrl+IgG and siAgo1+IgG, lytic phase. *P < 0.05. (c) The cell numbers at harvested points were counted. The dead cell ratios were calculated by 1 − (IgG stimulated cell numbers/nonstimulated cell numbers). (d) The mRNA expression levels of ASRs’ target genes were calculated by qPCR and calibrated with GAPDH. Relative expression levels are shown as fold-expression changes compared with that of the latent phase. Ctrl indicates latent phase; low, <40%; middle, 40–60%; high, >60% dead cell ratio. The data are shown as means and SD.

