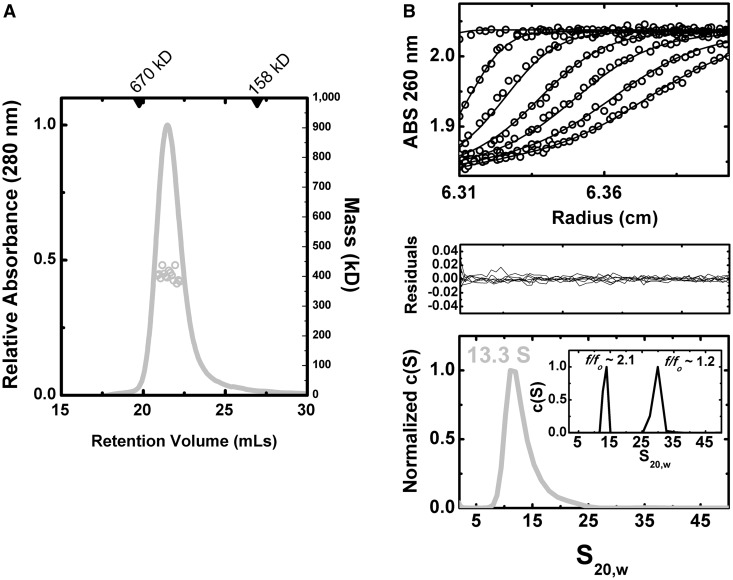
Figure 4.
Biophysical analysis of RNP particles. (A) Representative SEC-MALS analysis. Shown as a gray line is the absorbance profile of sample, as a function of elution time from a Superdex-200 10/300 column at room temperature (left axis). Corresponding gray circles denote molecular masses determined by in-line light scattering (right axis). Across the half-peak, the determined Mw was 404 kD ±0.6% using a mass-averaged dn/dc, consistent with a predicted molecular weight of 432 kD. (B) Sedimentation velocity analytical ultracentrifugation. c(S) distributions (lowest panel) were derived from the fitting of the Lamm equation to the experimental data collected, as implemented in the program SEDFIT (29). Shown in the inset of the bottom panel are simulated c(S) distributions for a particle of identical mass and composition to +A but with different frictional coefficients, corresponding to spherical (f/fo ∼1.2) and elongated (f/fo ∼2.1) forms. In the uppermost panel, fits of the experimental data (black circles) to the Lamm equation are shown as black lines; in middle panel the residuals from this fitting are shown. Measurements were performed at relatively low molar concentrations (∼10 ng/µl) and indicated a single species. Consistent with previous measurements, the +A particle showed a single peak with an S20,w value of 13.3 and a frictional coefficient (f/fo) of 2.1.

