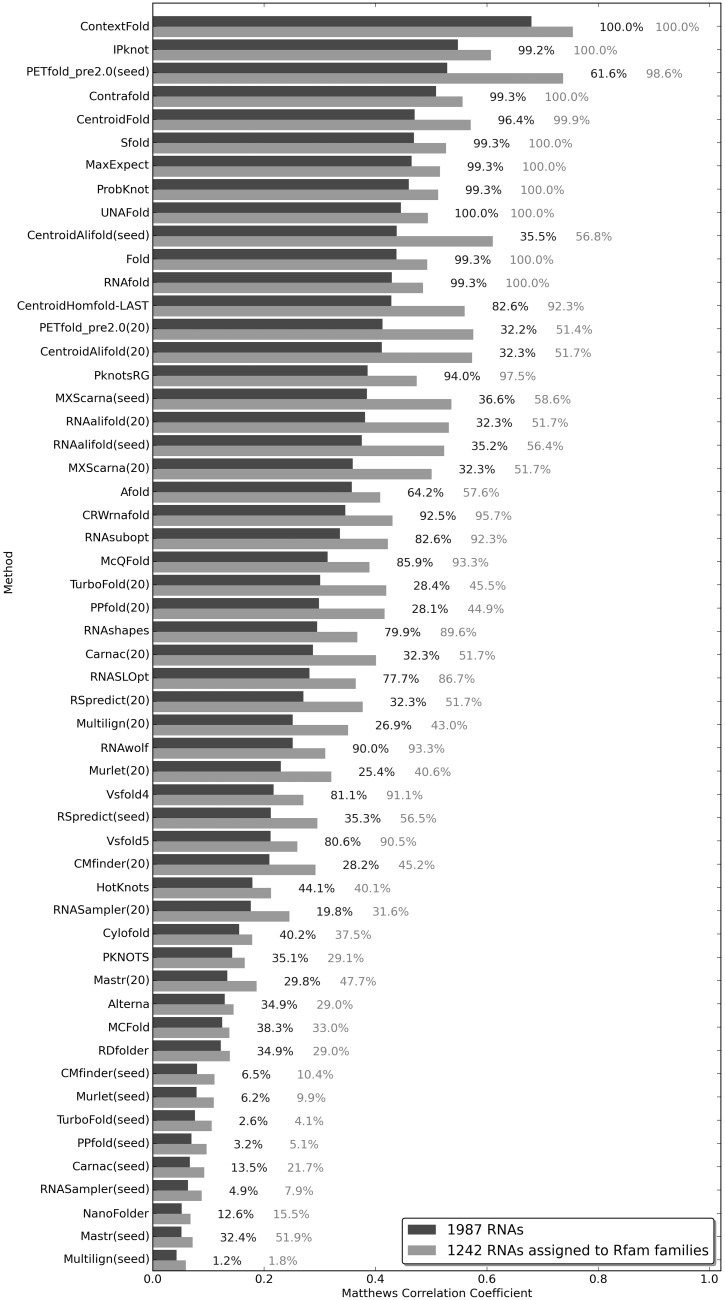
Figure 3.
The results of a robustness test on the RNAstrand data set. The numbers on the right to each bar correspond to the percent of RNAs for which a given method returned predictions (dark = 1987 RNAs from the RNAstrand data set; light = 1242 RNAs for which CompaRNA assigned an Rfam family). (20), refers to the test of a comparative method in which 20 representatives of an Rfam seed alignment were used; (seed), refers to the test in which all sequences from a given seed alignment were used.

