Figure 3.
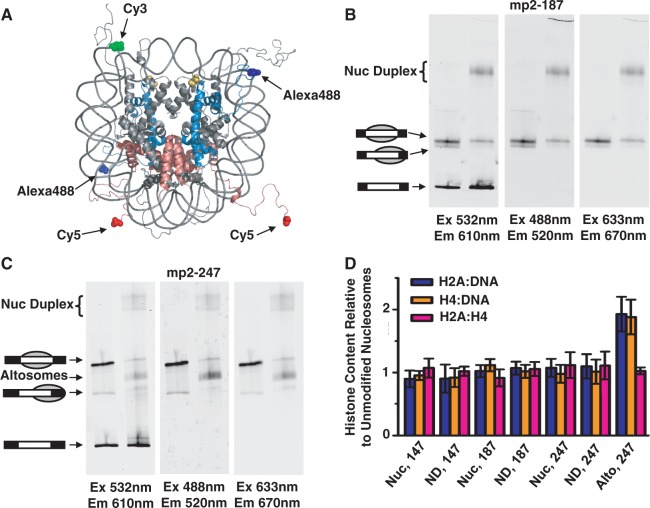
Relative DNA and histone content of nucleosome duplexes and altosomes. (A) Crystal structure (26) of nucleosome illustrating 5′ end-labeled DNA with Cy3 (green), Alexa488-labeled H4(C0) (blue) and Cy5-labeled H2A(C0) (red); H3(T118ph) in yellow. The histone tails are flexible and largely unstructured. EMSA of (B) Cy3-labeled mp2-187 and (C) Cy3-labeled mp2-247 DNAs reconstituted with fluorescent-labeled unmodified and H3(T118ph) HO. Each EMSA gel was imaged by the Cy3-DNA label (left, excitation at 532 nm, emission at 610 ± 10 nm), Alexa488-H4 label (middle, excitation at 488 nm, emission at 520 ± 10 nm) and Cy5-H2A label (right, excitation at 633 nm, emission at 670 ± 10 nm). (D) Fluorescence ratio of two fluorophore-labeled components (blue, Cy5-H2A versus Cy3-DNA; orange, Alexa488-H4 versus Cy3-DNA; pink, Cy5-H2A versus Alexa488-H4) for H3(T118ph) canonical nucleosomes (Nuc), nucleosome duplex (ND) and altosomes (Alto) species relative to the same two fluorophore-labeled components of the unmodified nucleosome species for each indicated DNA length in base pairs. Error bars are the standard deviation of three independent reconstitutions.

