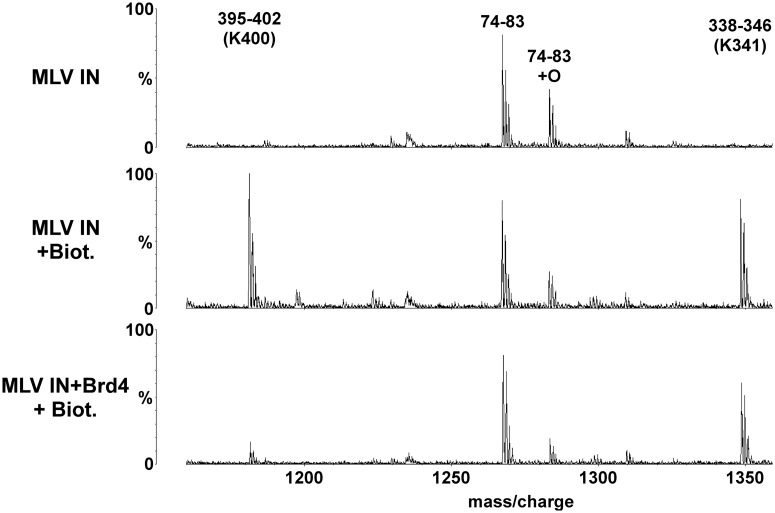
Figure 3.
MS-based footprinting of MLV IN interface interacting with Brd4. Representative sections of MALDI-ToF spectra of tryptic peptides of GST–MLV IN are shown. Conditions are indicated to the left with the top profile: GST–MLV IN alone; the middle profile: GST–MLV IN plus treatment with 1 mM NHS-biotin; and the bottom profile: GST–MLV IN preincubated with 6xHis–Brd4(1–720) and then treated with 1 mM NHS-biotin. The start and end amino acid numbers for each identified peak is shown. The Lys residues affected by NHS-biotin modification are indicated in brackets. Also shown are peaks of peptides (74–83) whose intensities do not vary as they do not contain any modified lysine residues allowing them to serve as internal controls.

