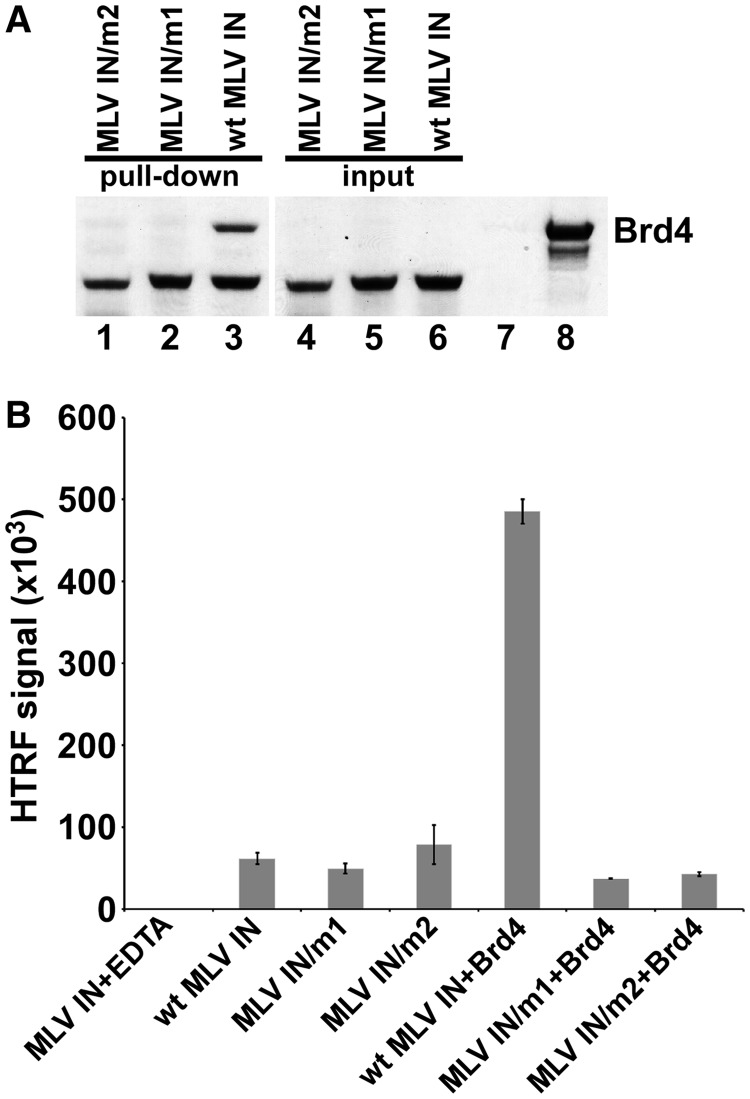
Figure 4.
Analysis of MLV IN/m1 and MLV IN/m2. (A) Binding of wild type and mutant MLV INs to Brd4. GST-tagged MLV IN/m2 (lane 1), GST-tagged MLV IN/m1 (lane 2) and wild-type MLV IN (lane 3) were used to pull-down 6xHis–Brd4(1–720). Lanes 4–6 show input of mutant and wild-type MLV INs. Lane 7: pull-down of 6xHis–Brd4 in the absence of MLV IN. Lane 8: input of 6xHis–Brd4. (B) Comparative HTRF-based strand-transfer activities of wild-type and mutant MLV INs in the presence and absence of 0.5 µM 6xHis–Brd4. As a control, 50 mM EDTA was added to a reaction containing both 6xHis–Brd4 and GST–MLV IN. Bars represent means ± SD [n = 3].

