Figure 6.
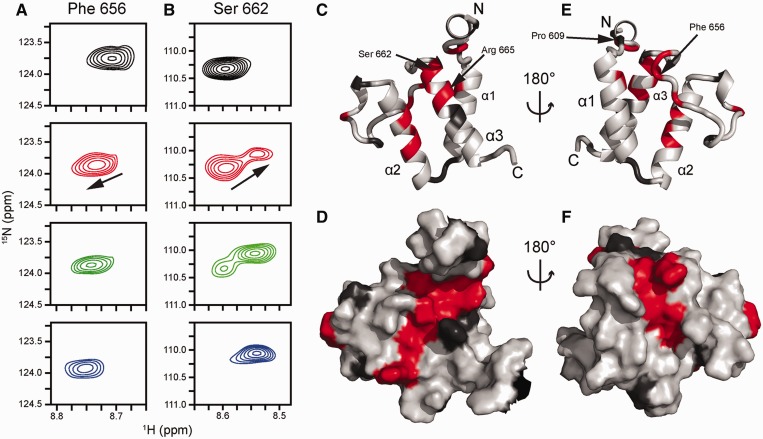
Perturbation of amide NMR signals of Brd4 ET upon titration with MLV IN CTD. (A) Amide resonance from F656, which exhibits fast exchange and averaging between the free and bound chemical shifts. (B) Amide resonances from S662. This signal exemplifies the slow exchange regime, which is characterized by slow disappearance of the free peak coupled to the appearance of the bound peak. Top (black) spectra, unliganded Brd4 ET; second row (red), Brd4 ET with 0.5 equivalents of MLV CTD; third row (green), Brd4 ET with 1 equivalent of MLV CTD; bottom row (blue), Brd4 ET with 1.5 equivalents of MLV CTD. The black arrow indicates the direction of the CSP from the unliganded to the bound state. Resonance assignments are as previously reported (38). CSPs mapped onto the cartoon (C) and surface (D) views of the Brd4 ET structure (PDBID: 2JNS) (38) to demonstrate a putative MLV IN-binding interface. Light grey coloring indicates residues whose backbone amide CSP (Supplementary Figure S2) is <0.02 ppm. Dark grey coloring indicates residues with no data either due to being proline or spectral overlap. Red coloring indicates residues whose backbone amide CSP (Supplementary Figure S2) being >0.02 ppm due to MLV IN binding to Brd4 ET which include residues 607, 608, 615, 632, 633, 634, 636, 646, 654, 655, 656, 657, 662, 663, 665, 666 and 667. Specific residues are highlighted for reference.

