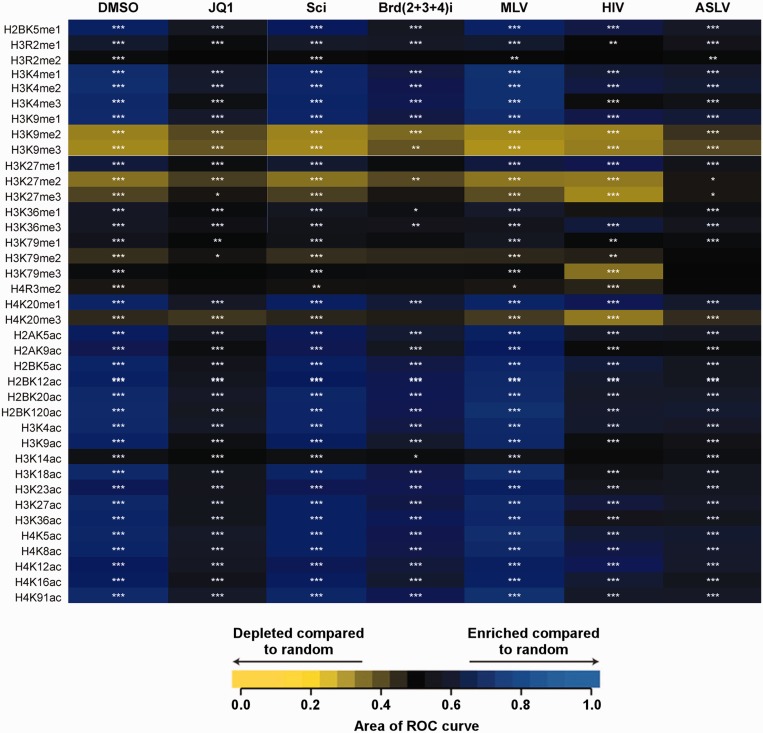
Figure 8.
Heatmap summarizing integration frequencies relative to histone post-translational modifications. Integration site datasets are shown in the columns. Histone post-translational modifications are shown in the rows and labeled on the left. The receiver operator characteristic (ROC) curve area method was used to quantify the relationship between the integration site frequencies relative to matched random controls for each of the annotated histone post-translational modification shown on the left. The color key depicts enrichment or depletion of the annotated feature-near integration sites (enrichment is indicated in blue and depletion is indicated in yellow; intensity of the color indicates the strength of the effect). P-values are for individual integration site datasets compared to matched random controls, ***P < 0.001; **P < 0.01; *P <0.05. ‘JQ-1’ indicates 500 nM JQ-1 inhibitor treatment, ‘Sci’ indicates scrambled control siRNA knockdown, ‘Brd(2+3+4)I’ indicates siRNA knockdown of all three BET proteins.

