Figure 6.
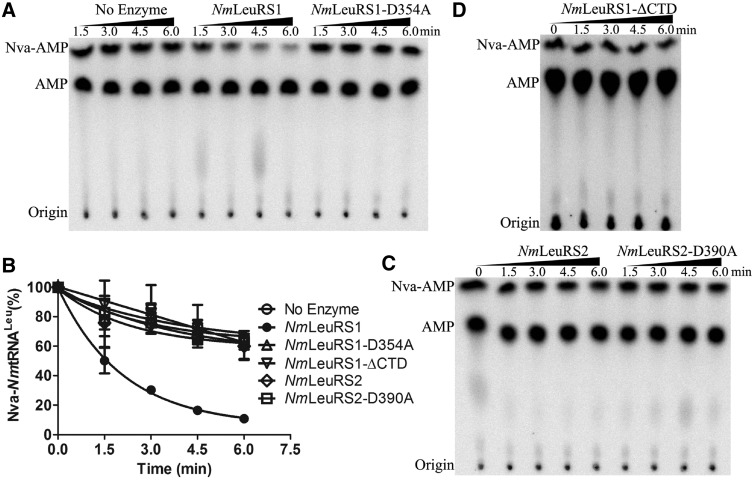
NmLeuRS1 but not NmLeuRS2 deacylates Nva-NmtRNALeu. (A) Representative graph showing the post-transfer editing activity of 500 nM NmLeuRS1 and 500 nM NmLeuRS1-D354A based on TLC assay. (B) Quantification of the deacylation activities of NmLeuRS (black circle), NmLeuRS1-D354A (white up-pointing triangle), NmLeuRS1-ΔCTD (white down-pointing triangle), NmLeuRS2 (white diamond) and NmLeuRS2-D390A (white square) in A, C and D. Representative graphs showing the post-transfer editing activity of 500 nM NmLeuRS2 and 500 nM NmLeuRS2-D390A (C), 500 nM NmLeuRS1-ΔCTD (D) based on TLC assay.

