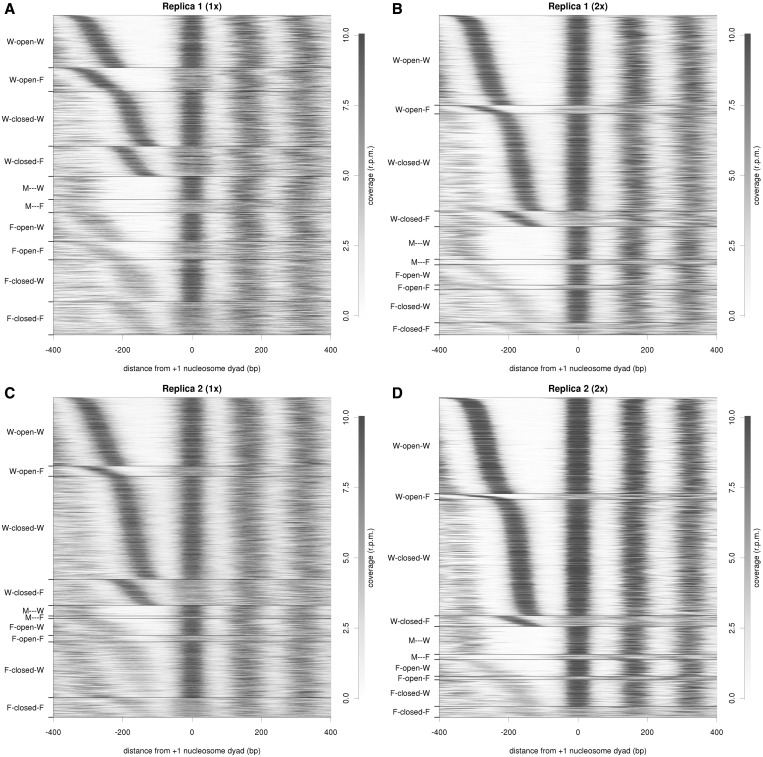
Figure 1.
Nucleosome coverage and gene clustering in single- and paired-end sequencing. Heat maps showing nucleosome occupancy around TSS in replicas 1 (top) and 2 (bottom) for single-end sequencing (1x, left) and paired-end sequencing (2x, right). Genes are clustered based on their nucleosome profile and their coverage is plotted taking +1 nucleosome dyad as ′0′.

