Figure 6.
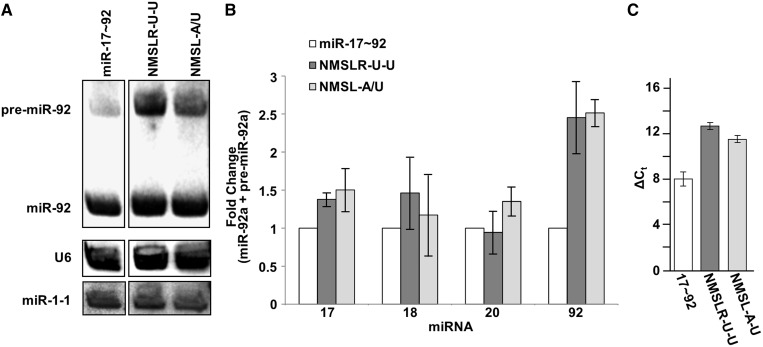
Drosha (Microprocessor) processing of miR-17∼92, NMSL-A/U and NMSLR-A/U pri-miRNA. (A) Northern blot of miR-92a expression from cells transiently expressing wild-type miR-17∼92, NMSLR U-U or NMSL A/U. U6 is probed as a loading control, miR-1 is a transfection efficiency control. (B) Total expression of the individual premature and mature miRNAs from the NMSLR-U-U and NMSL-A/U mutant clusters (corrected for background endogenous expression, lane loading and transfection efficiency), normalized to expression from the wild type pri-miRNA cluster. miR-92a expression shows the highest increase in relative expression. Data are averaged from three independent experiments. Error bars represent one standard deviation. (C) Comparative quantitative RT-PCR of ITGA5 mRNA from HEK293T cells expressing wild-type miR-17∼92, or the NMSLR U-U, or NMSL A/U mutants using β-actin mRNA as an internal standard generated ΔΔCt values of 4.5 ± 1.4 and 3.4 ± 1.3, respectively. Error bars indicate one standard deviation.

