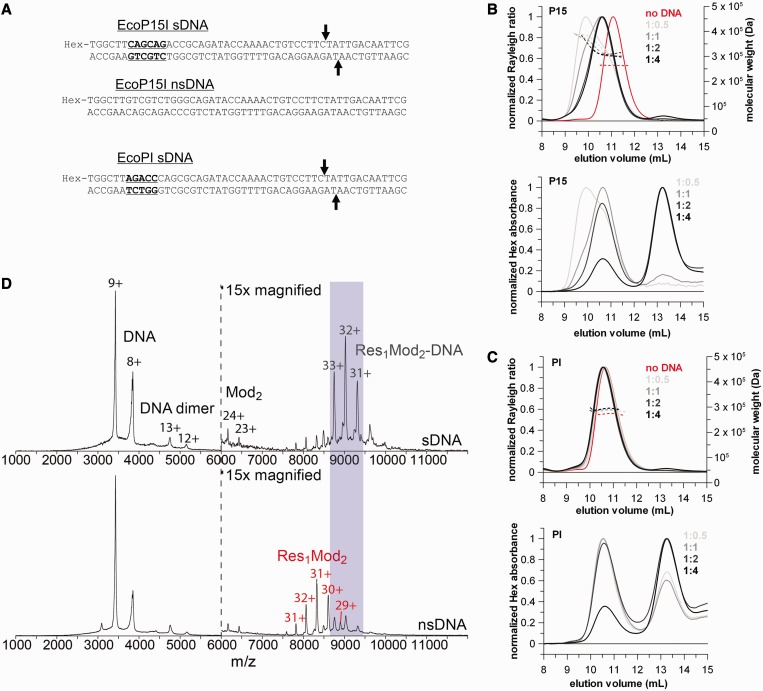
Figure 2.
The heterotrimer Type III REs bind a single DNA with a specific site despite the presence of two target recognition domains. (A) Sequence of the specific (sDNA) and non-specific ns(DNA) 50-mer DNA duplexes. The 5′-CAGCAG-3′ and 5′-AGACC-3′ recognition sites for EcoP15I and EcoPI, respectively, are highlighted with bold and underlined fonts. The cleavage positions (25 and 27 bases downstream of the recognition site in the top and bottom strand, respectively) are marked with arrows. (B and C) SEC-MALS traces of a constant amount of EcoP15I (B) or EcoPI (C) with sub-stoichiometric amounts to saturating excess of the relevant specific 50-mer DNA duplex (ratios are enzyme:DNA). In the upper graphs, solid lines represent the normalized light scattering (left Y-axis), whereas dotted lines show the calculated molecular masses (right Y-axis). In the lower graphs, lines show the hexachlorofluorescein (Hex) absorbance traces of the same SEC-MALS runs to confirm the presence of DNA in the eluted complexes. (D) Native mass spectra of wt EcoP15I pre-incubated with a 2-fold excess of specific (top panel) and non-specific (bottom panel) 50-mer duplex DNA. The Y-axis is relative intensity, scaled to the most intense peak in the spectrum, which is the 9+ charge state of the free DNA. Peaks on the left hand side of the dotted vertical line correspond to free excess DNA, whereas peaks on the right hand side can be identified as Res1Mod2 heterotrimers in complex with a single copy of specific DNA or free Res1Mod2 holoenzyme in the case of non-specific DNA. As the protein ionizes much less efficiently than the DNA, the protein and protein–DNA peaks have been magnified ×15 relative to the DNA-alone peaks for presentation purposes.

