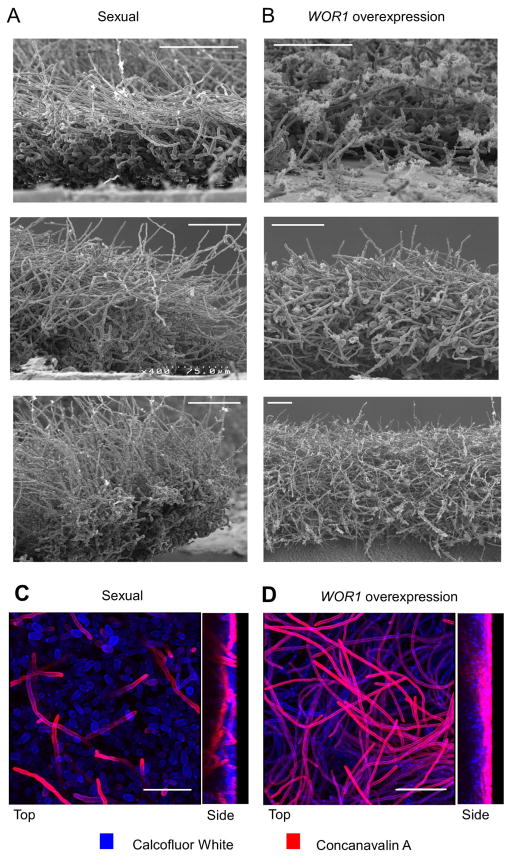
Figure 4.
Microscopic analysis of C. tropicalis sexual and WOR1 overexpression biofilms. Scanning electron micrographs showing side views of biofilms formed after 48 hours of development. (A) C. tropicalis a and α opaque cells (sexual biofilm). (B) WOR1 overexpression biofilm. 600X (top image), 400X (middle and bottom left images) or 200X magnification (bottom right). Scale bar = 60 μm (valid only in foreground). Confocal imaging of (C) sexual and (D) WOR1 overexpression biofilms. Left, top views projected from outer biofilm surface inward. Right, side views of biofilms. Images were taken with the same settings to allow for direct comparison. Scale bar = 36 μm. Blue = Calcoflour White. Red = Rhodamine conjugated Concanavalin A.

