
Figure 2.
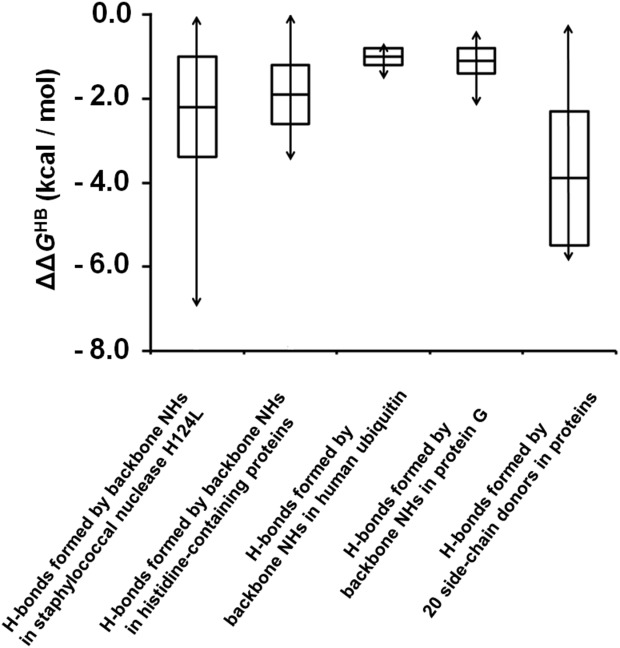
Distribution of protein hydrogen bond strengths. The average ΔΔGHB values, for backbone NH groups and side-chain donorsare shown as a bar in the middle of each box. The standard deviations, determined by considering both the uncertainty in the scale factor and the standard deviations of the φ-values, are indicated as the distance between the middle bar and the upper or lower edge of each box. The ranges of ΔΔGHB are indicated by the double-headed arrows across each box.