
Figure 3.
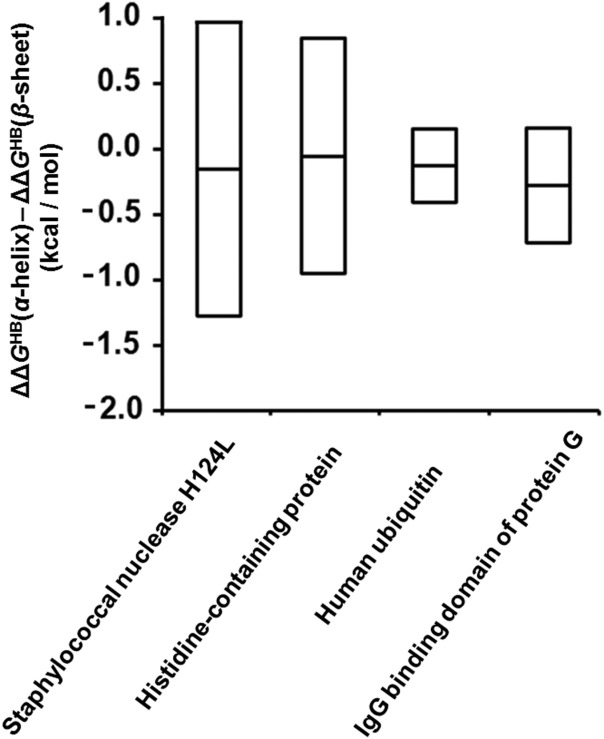
Comparison between backbone hydrogen bond strengths in α-helices and β-sheets. The differences between ΔΔGHB-values for α-helices and for β-sheets, ΔΔGHB(α-helix)–ΔΔGHB(β-sheet), in various proteins. The average values are shown as a bar in the middle of each box. The standard deviations, determined by considering both the uncertainty in the scale factor and the standard deviations of the φ-values, are indicated as the distance between the middle bar and the upper or lower edge of each box.