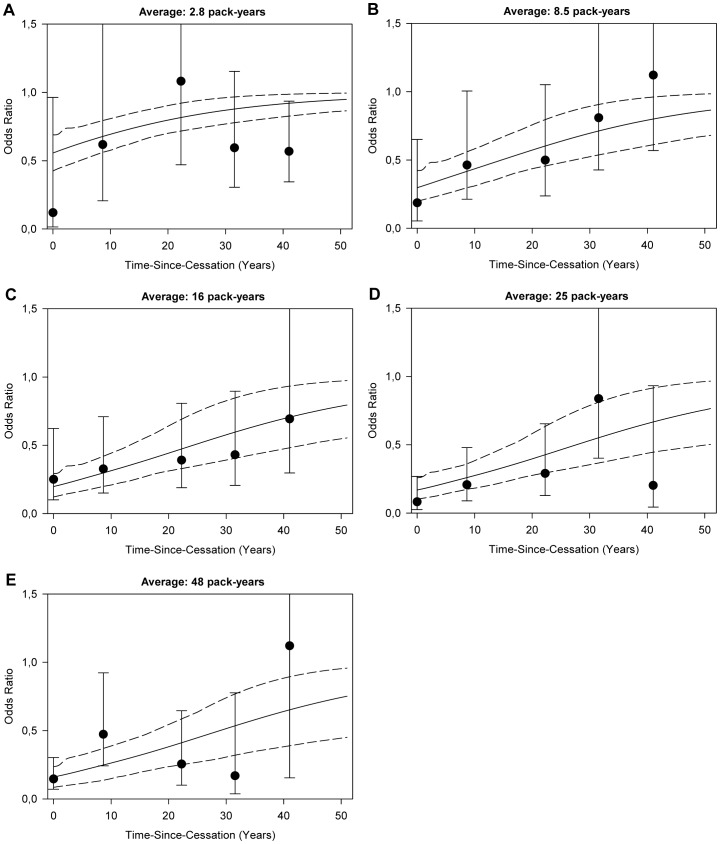
Figure 2. Odds ratios and 95% confidence intervals for time-since-cessation within categories of total pack-years of smoking.
A–E: Ever smokers were divided according to quintiles of total-smoking and the effect of time-since-cessation within those groups was plotted. ORs were located at the quintile-specific average time-since-cessation and based on unconditional logistic regression relative to never-smokers adjusted for age, sex and center. The lines represent the predicted ORs and 95% confidence intervals for different levels of time-since-cessation based on the excess OR model plotted for the quintile-specific average pack-years of total smoking.

