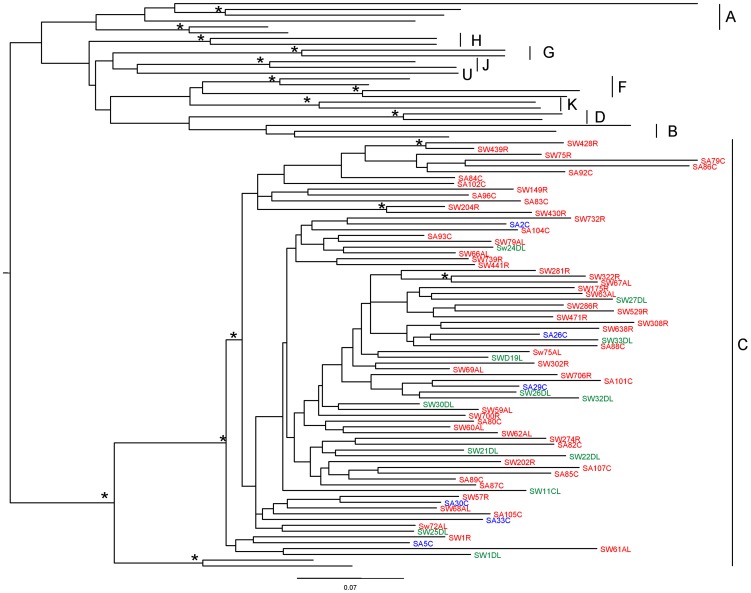
Figure 1. V3–V5 phylogenetic tree of HIV-1 strains from 72 HIV-1-infected patients in South Africa and Swaziland.
Tree was rooted by using the midpoint rooting method. Scale bar at the bottom indicates 7% nucleotide substitutions per site. The asterisk along a branch represents the bootstrap value (significant statistical support) >70% and p<0.001 in the zero-branch-length test. Years of collection of samples are color-highlighted: 2005 in blue, 2006 in red and 2007 in green. Country where sample collection was performed: SW = Swaziland; SA = South Africa.

