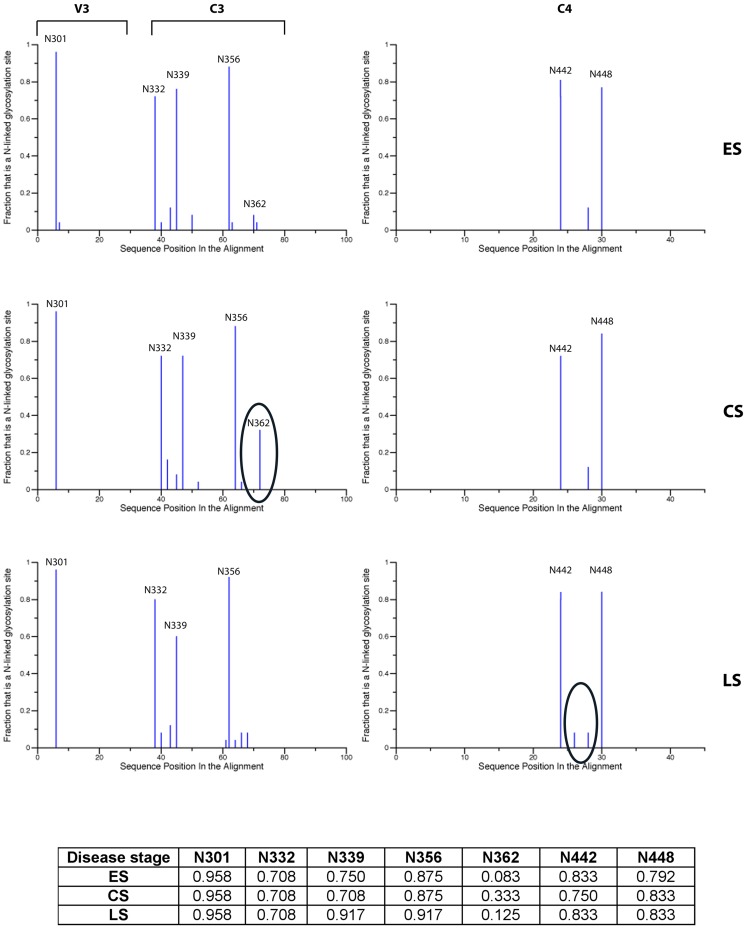
Figure 2. Distribution of PNGS in V3, C3 and C4 regions of gp120 in HIV-1 clade C variants obtained during different disease stages.
Table at the bottom reports the frequency of presence of each PNGS. PNGS position in the alignment is according to the HXB2 amino acid sequence numbering. Circles highlight a significant increase of shifting PNGS frequency ES = Early disease Stage CS = Chronic disease Stage LS = Late disease Stage.

