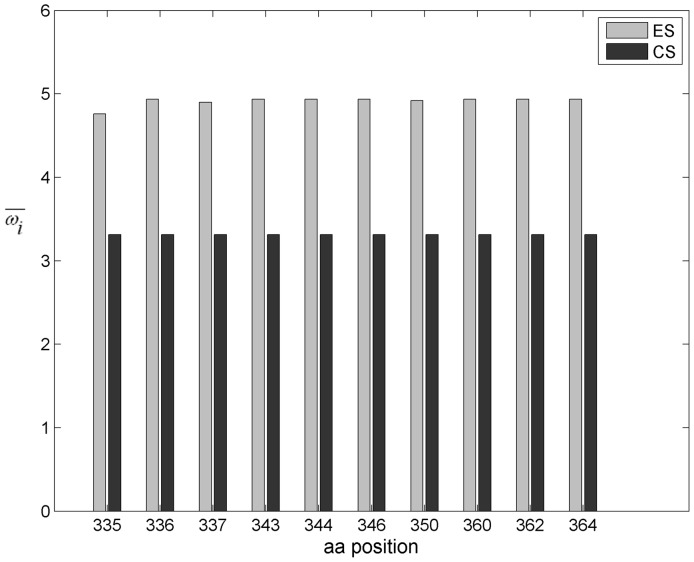
Figure 3. Strength of positive selection of sites in the C3 region during the early and chronic disease stages.
The strength of positive selection (ω) for each amino acid site is reported in the y axis. Sites are reported in the x axis. Amino acids numbering is according to HXB2 sequence. Grey and black bars show the strength of positive selection of each of the sites for the early infection stage (ES) and the chronic infection stage (CS), respectively. Statistical significance of the difference between the two series: p = 0.00016.

