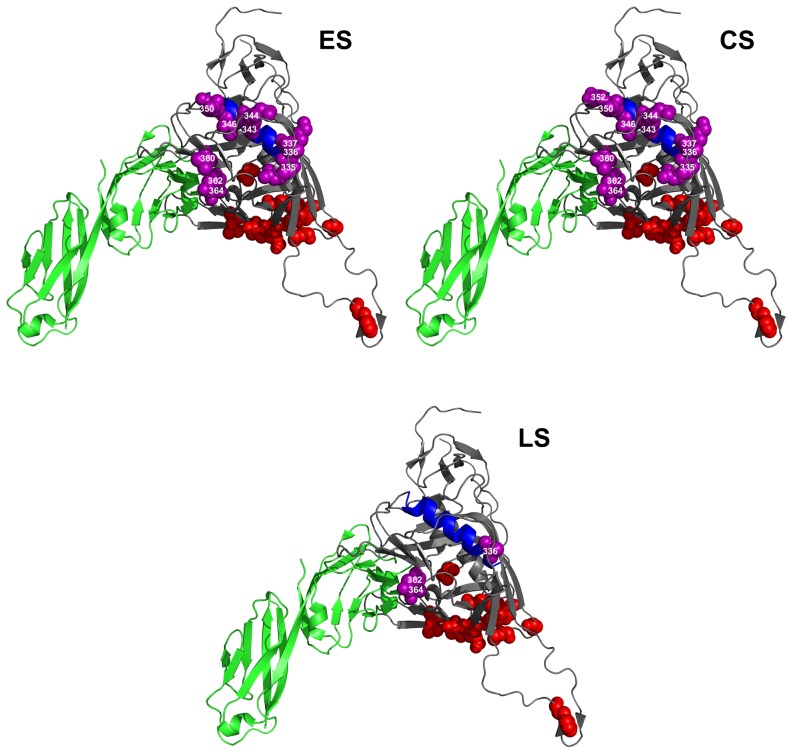
Figure 4. Sites under positive selection pressure in C3 region at different disease stages.
HIV-1 gp120 protein model is from JR-FL strain [45]. Sites under selection pressure are indicated as spheres in purple. Labeling of each positively selected site is centered on the α-carbon of the amino acid. CD4 receptor is in green. Residues involved in CCR5 binding are indicated as spheres in red. The α2 helix region is indicated in blue. Amino acid numbering is according to HXB2 sequence. ES = Early disease Stage CS = Chronic disease Stage LS = Late disease Stage.

