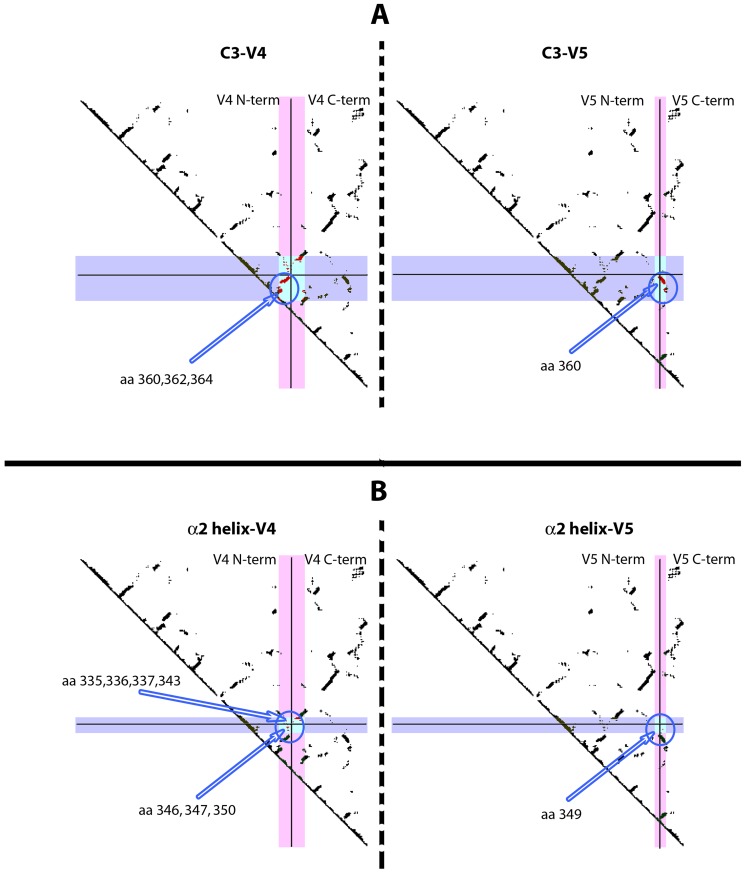
Figure 9. Contact maps between C3-V4, C3-V5, α2 helix-V4 and α2 helix-V5 of gp120.
Contact maps are generated from the crystallographic structure of the CD4-bound JR-FL2 gp120 [45]. Regions are indicated in violet and in pink. The boxed area in light blue is the contact area. Solid lines split the region in the N-terminal and C-terminal portions. In the contact areas, only amino acids that have been found under positive selection are shown (indicated by arrows and circled). Amino acid numbering is according to HXB2 sequence. Panel A) left: C3 region is reported horizontally (in violet), V4 region vertically (in pink). Panel A) right: C3 region is reported horizontally (in violet), V5 region vertically (in pink). Panel B) left: α2 helix is reported horizontally (in violet), V4 region vertically (in pink). Panel B) right: α2 helix is reported horizontally (in violet), V5 region vertically (in pink).

