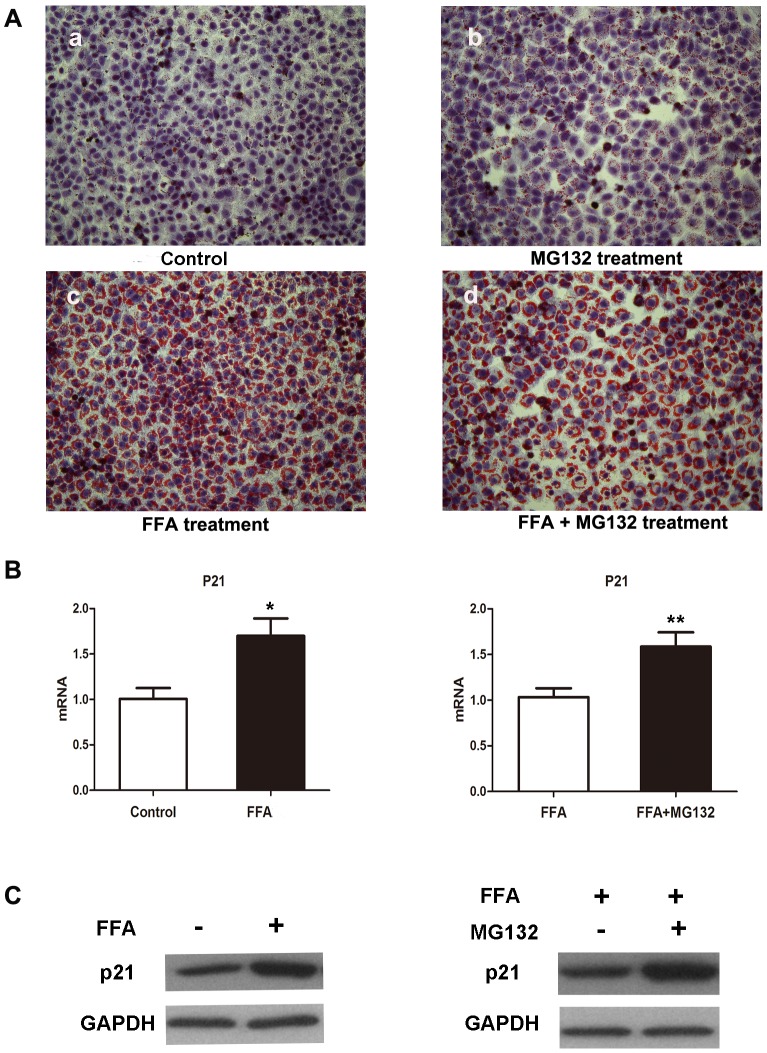
Figure 1. Effects of different treatment on lipid accumulation of L02 cells.
(A) Representative micrographs showing intracellular lipid accumulation in L02 cells as stained by Oil Red O (magnification, 200×). Panels a, b, c, d are control cells, cells treated with 3 µM MG132, 1 mM FFA, 1 mM FFA plus 3 µM MG132, respectively for 48 hr. (B) Intracellular mRNA levels of p21 in the indicated groups quantitated by RT-PCR. Values were means ± standard deviation. *p<0.05 compared with L02 cells buffered in DMEM. **p<0.05 compared with L02 cells buffered in FFA. (C) Western blot analysis of cellular p21 protein level in the indicated groups, which were treated with DMEM, 1 mM FFA, 1 mM FFA plus 3 µM MG132 respectively for 48 hr.

